
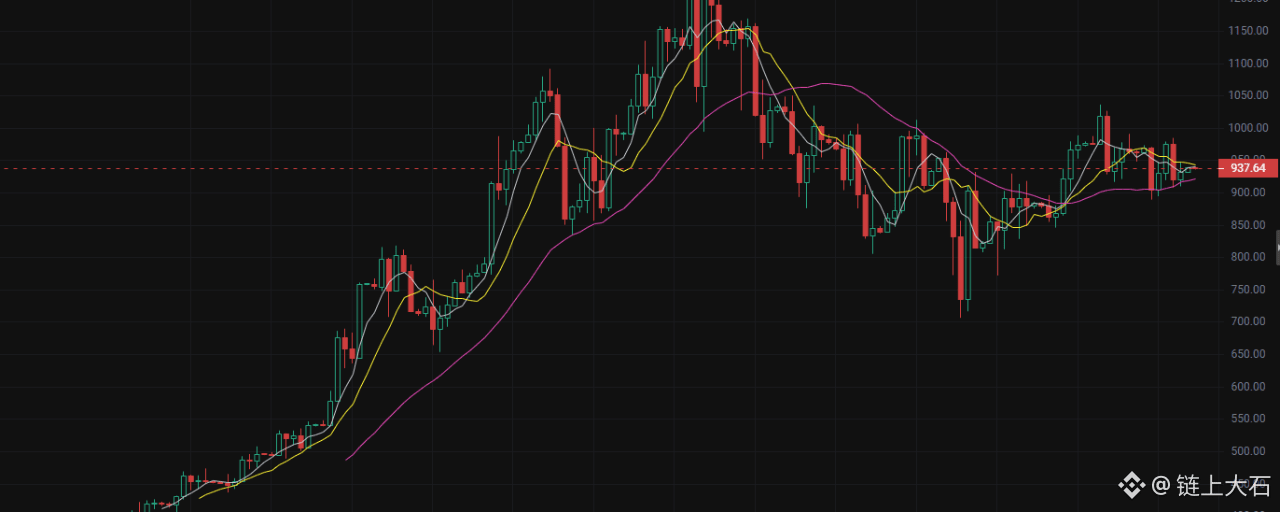

Today is August 30, and the MU reference price is 937.24.
First, look at the big picture: MU has recently been in an extremely strong high-volatility phase. According to publicly available market data, the closing price on August 28 was about $932.86, and over the past few trading days prices have repeatedly fought back and forth in the $900–$950 range. At the same time, MU’s gains this year are still astonishing, which indicates that the medium- to long-term uptrend has not been easily changed.
So today’s trading approach should not be understood simply as “being bearish on the overall trend,” but rather as catching short-term pullbacks within a high-level range. If around 937.24 it keeps failing to push higher and break through, then short-term bears may gain control.
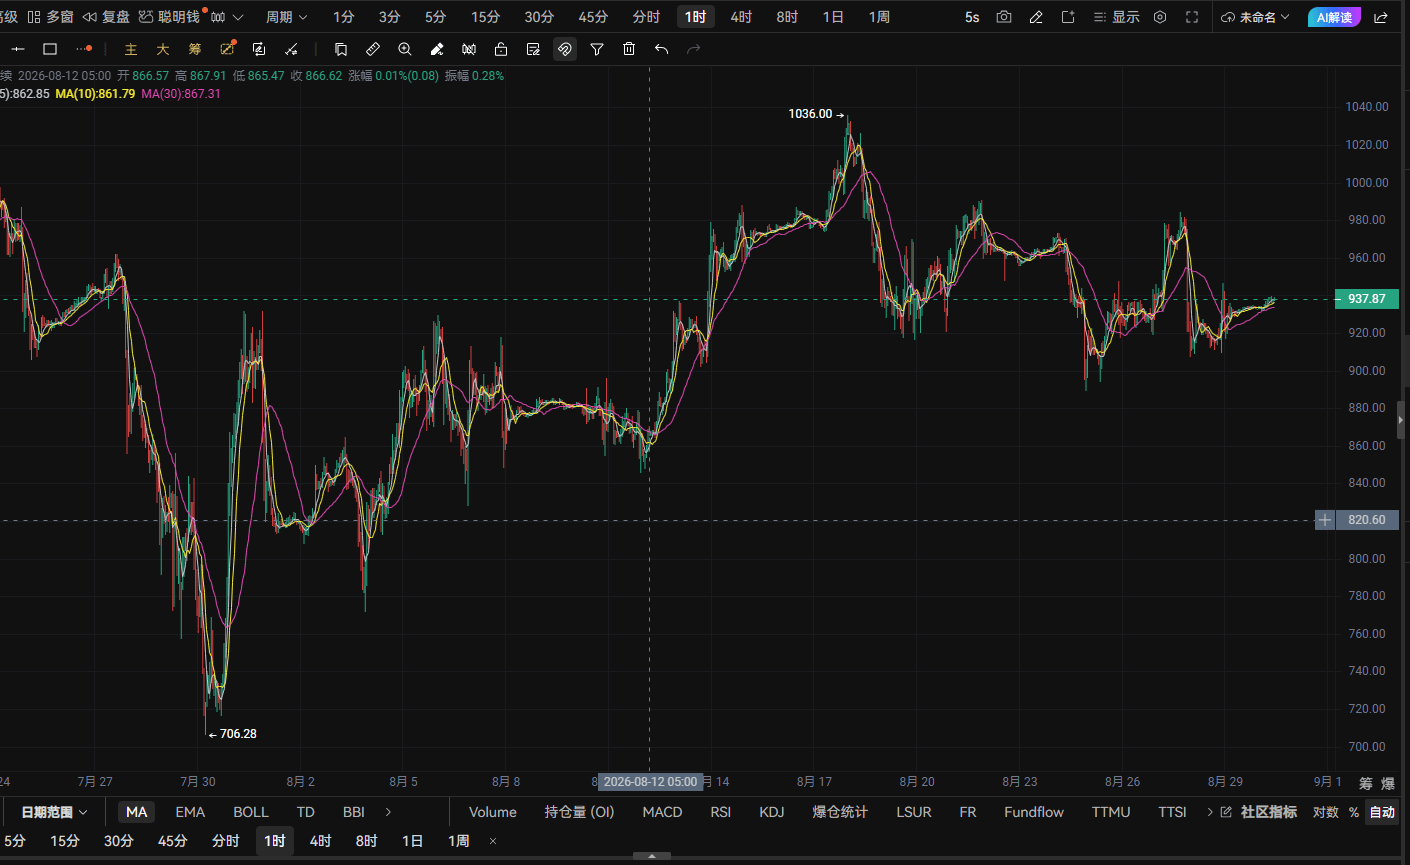
1-hour chart: Selling pressure on the way up; prioritize looking for pullbacks short term
From the 1-hour timeframe, price has already entered a crucial short-term battle zone near 937.24.
After the earlier rapid surge, price is clearly now in a high-level consolidation phase. At this position, the biggest taboo is blindly chasing higher—especially when there is obvious resistance overhead. If bulls repeatedly attempt to break through but cannot generate a valid continuation, profit-taking is likely to be triggered.
Today, focus on the strength of the rebound and the structure of the highs on the 1-hour chart.
If after a rebound/overshoot price again turns lower from a high, and the candlesticks cannot effectively hold above the resistance, then the short-term bearish signal will strengthen further.
Therefore, on the 1-hour timeframe today, the main approach is to short on rebounds under resistance.
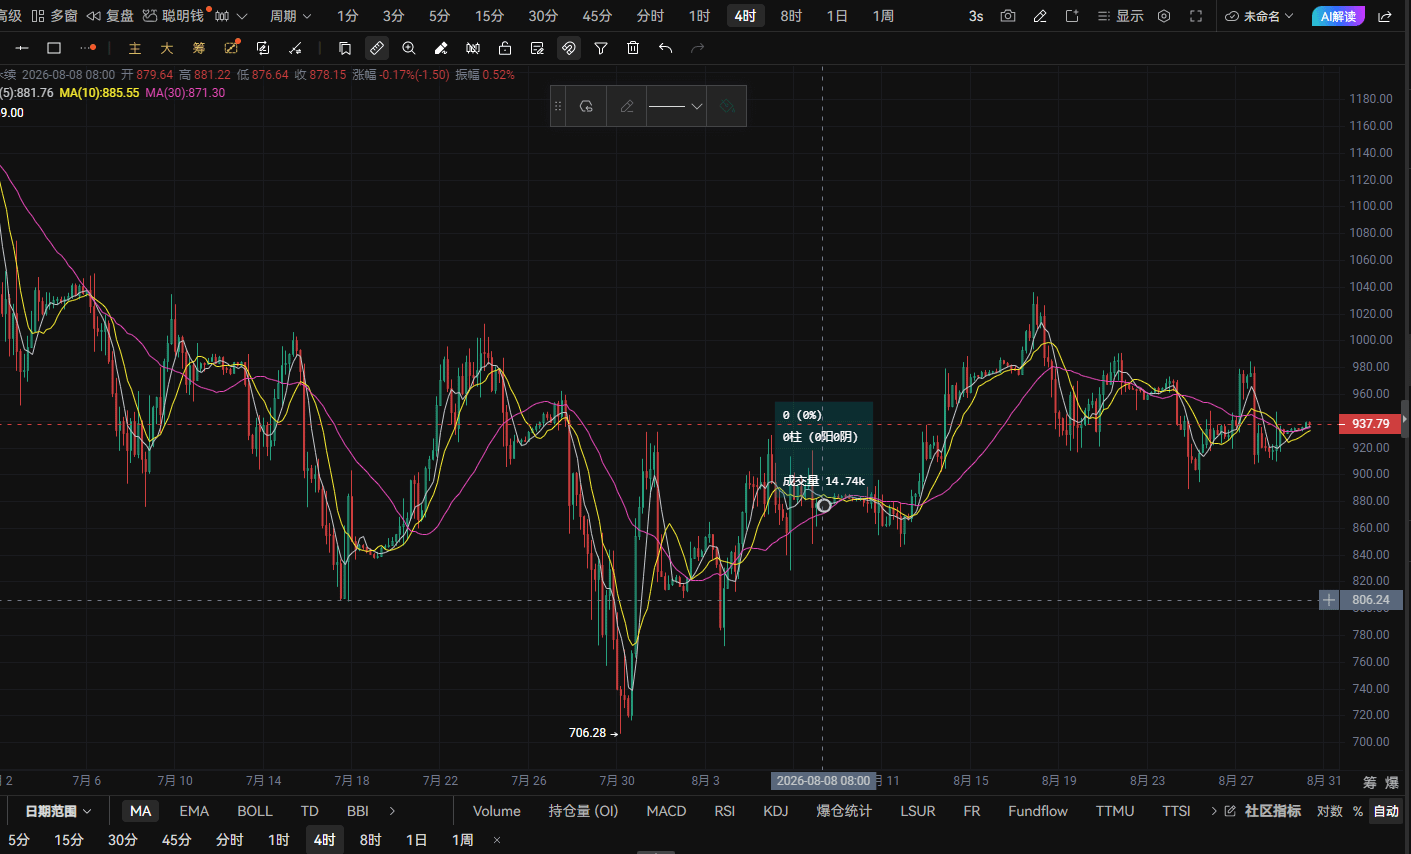
4-hour chart: High-level consolidation is intensifying; pullback risk is being released
The 4-hour timeframe is even more worth watching.
MU saw extremely strong gains earlier, and then moved into high-level consolidation. Based on publicly available market data, MU’s weekly performance has already shown a clear pullback recently, but the monthly trend remains upward. This suggests that, in essence, it’s still high-volatility consolidation within a strong trend.
With this structure, the bulls haven’t completely lost their advantage, but the short term is no longer suitable for blindly chasing longs.
If on the 4-hour timeframe price still cannot reopen upside space, then profit-taking by funds may push price downward to find support.
Especially pay attention to whether the lower support is being tested repeatedly.
Hold support and price may keep consolidating; if support breaks, the room for a pullback will open up further.
So on the 4-hour timeframe, today still maintains the trading mindset of being bearish at high levels and shorting rebounds.
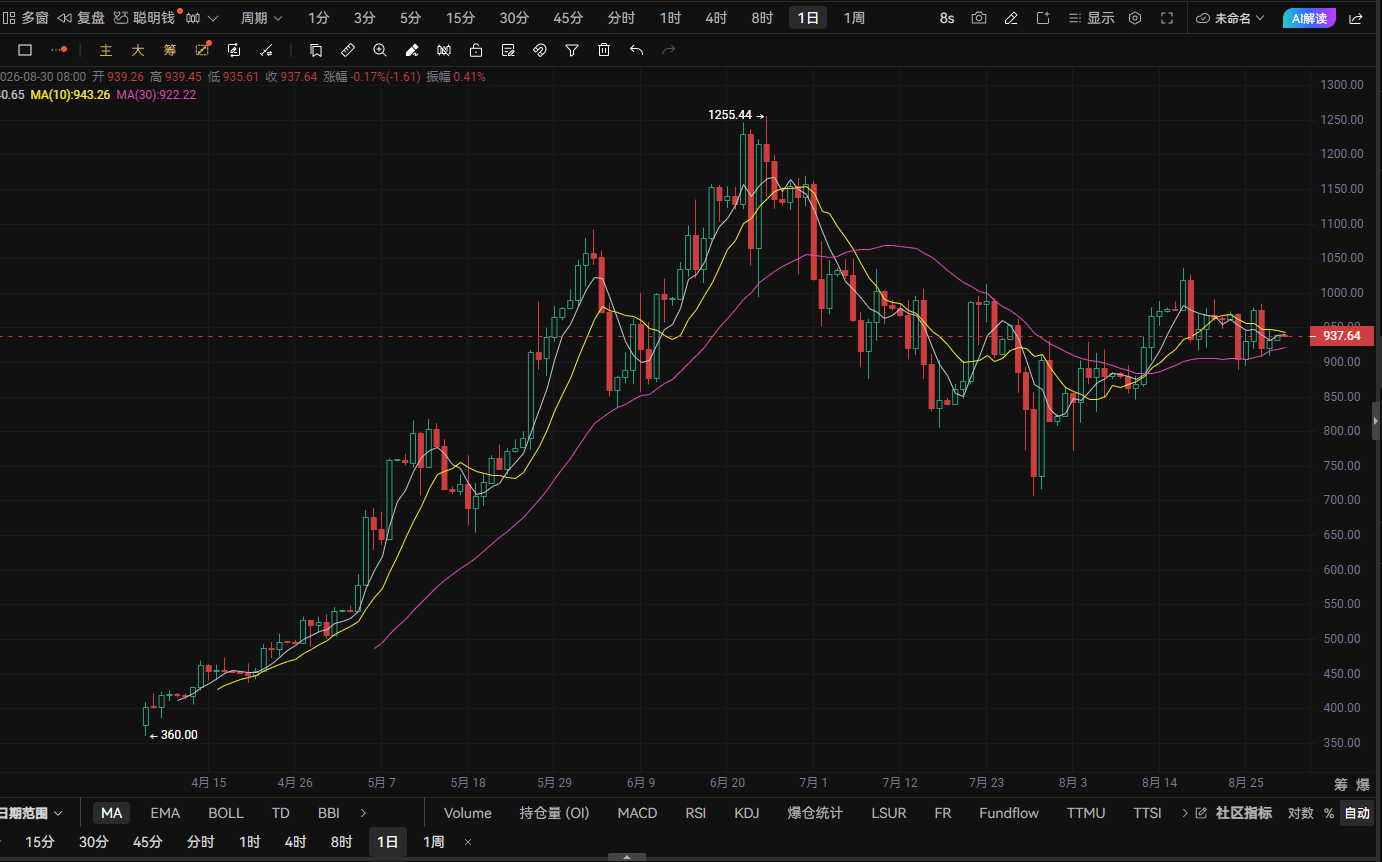
Daily chart: The trend is still strong, but at the current position you must guard against a pullback
Don’t ignore MU’s strong long-term trend at the daily level.
In the recent market, AI storage demand is still expected to stay strong. MU’s latest earnings report and subsequent guidance have been robust, and market expectations for demand in areas such as HBM and DRAM remain high.
But technical trading focuses on separating trend from position.
A strong long cycle doesn’t mean the short term won’t correct.
After MU’s sharp advance earlier, it is now in a high-level area, and daily-level volatility has increased noticeably. Public market data also shows that after MU quickly pulled back from the highs, it rebounded again, indicating that disagreement between bulls and bears is very pronounced right now.
Therefore, today’s daily view is defined as:
The medium-to-long-term trend is relatively bullish, while the short term is consolidating at high levels. Don’t chase upside; instead, look for pullback opportunities after a run-up.
Today’s trading summary
Considering the 1-hour, 4-hour, and daily cycles together:
1-hour: Rebound meets resistance; short-term bias is bearish.
4-hour: High-level consolidation; pullback risk is increasing.
Daily: The big trend is still strong, but it’s not advisable to chase at the highs.
So today’s core strategy is very clear:
Focus on short opportunities near 937.24.
If price rebounds and fails to break resistance effectively, the bears will continue to look for a pullback. If the market drops quickly, the first target should be short-term support; after support fails further, then look at the second target.
Trading isn’t about who can predict the most accurately—it’s about who can see clearly, execute steadily, and stick to discipline.
🚨 Live trade | Open short directly at the current price
Instrument: $MU
Current price: 937.24
Direction: Short ⬇️
Entry: 937.24
Stop-loss: 951.30
First take-profit: 927.87
Second take-profit: 918.50
Execution idea: Open a short directly at the current price. If the rebound fails to break through, continue holding; after the first target is taken, assess the strength of the bears. If the down move continues, then look at the second target. Strictly follow the stop-loss—don’t carry losing positions and don’t chase losses.
One sentence for today: Watch the trend at the highs; watch the rhythm on pullbacks. As long as 937.24 is not broken, the bears still have room! 🔥$NVDA $SNDK