
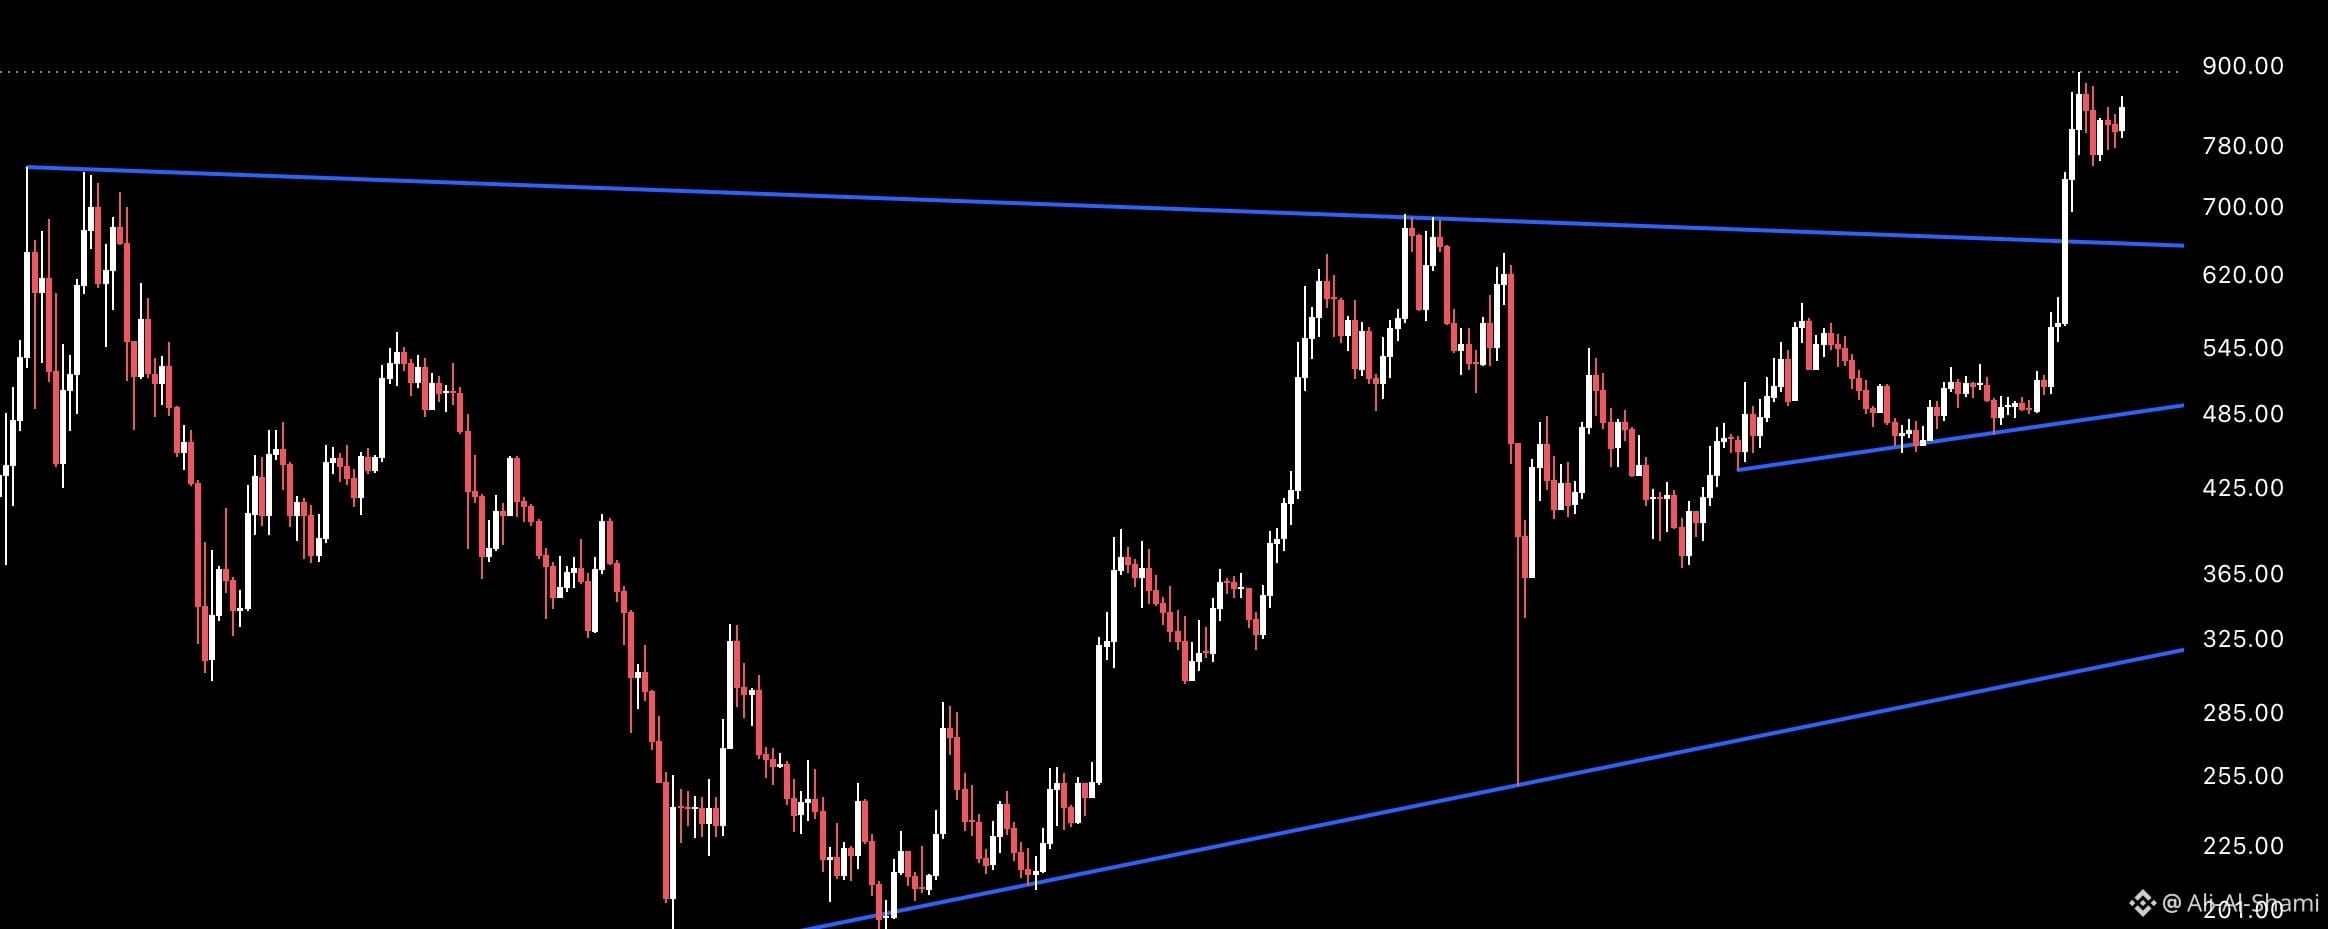

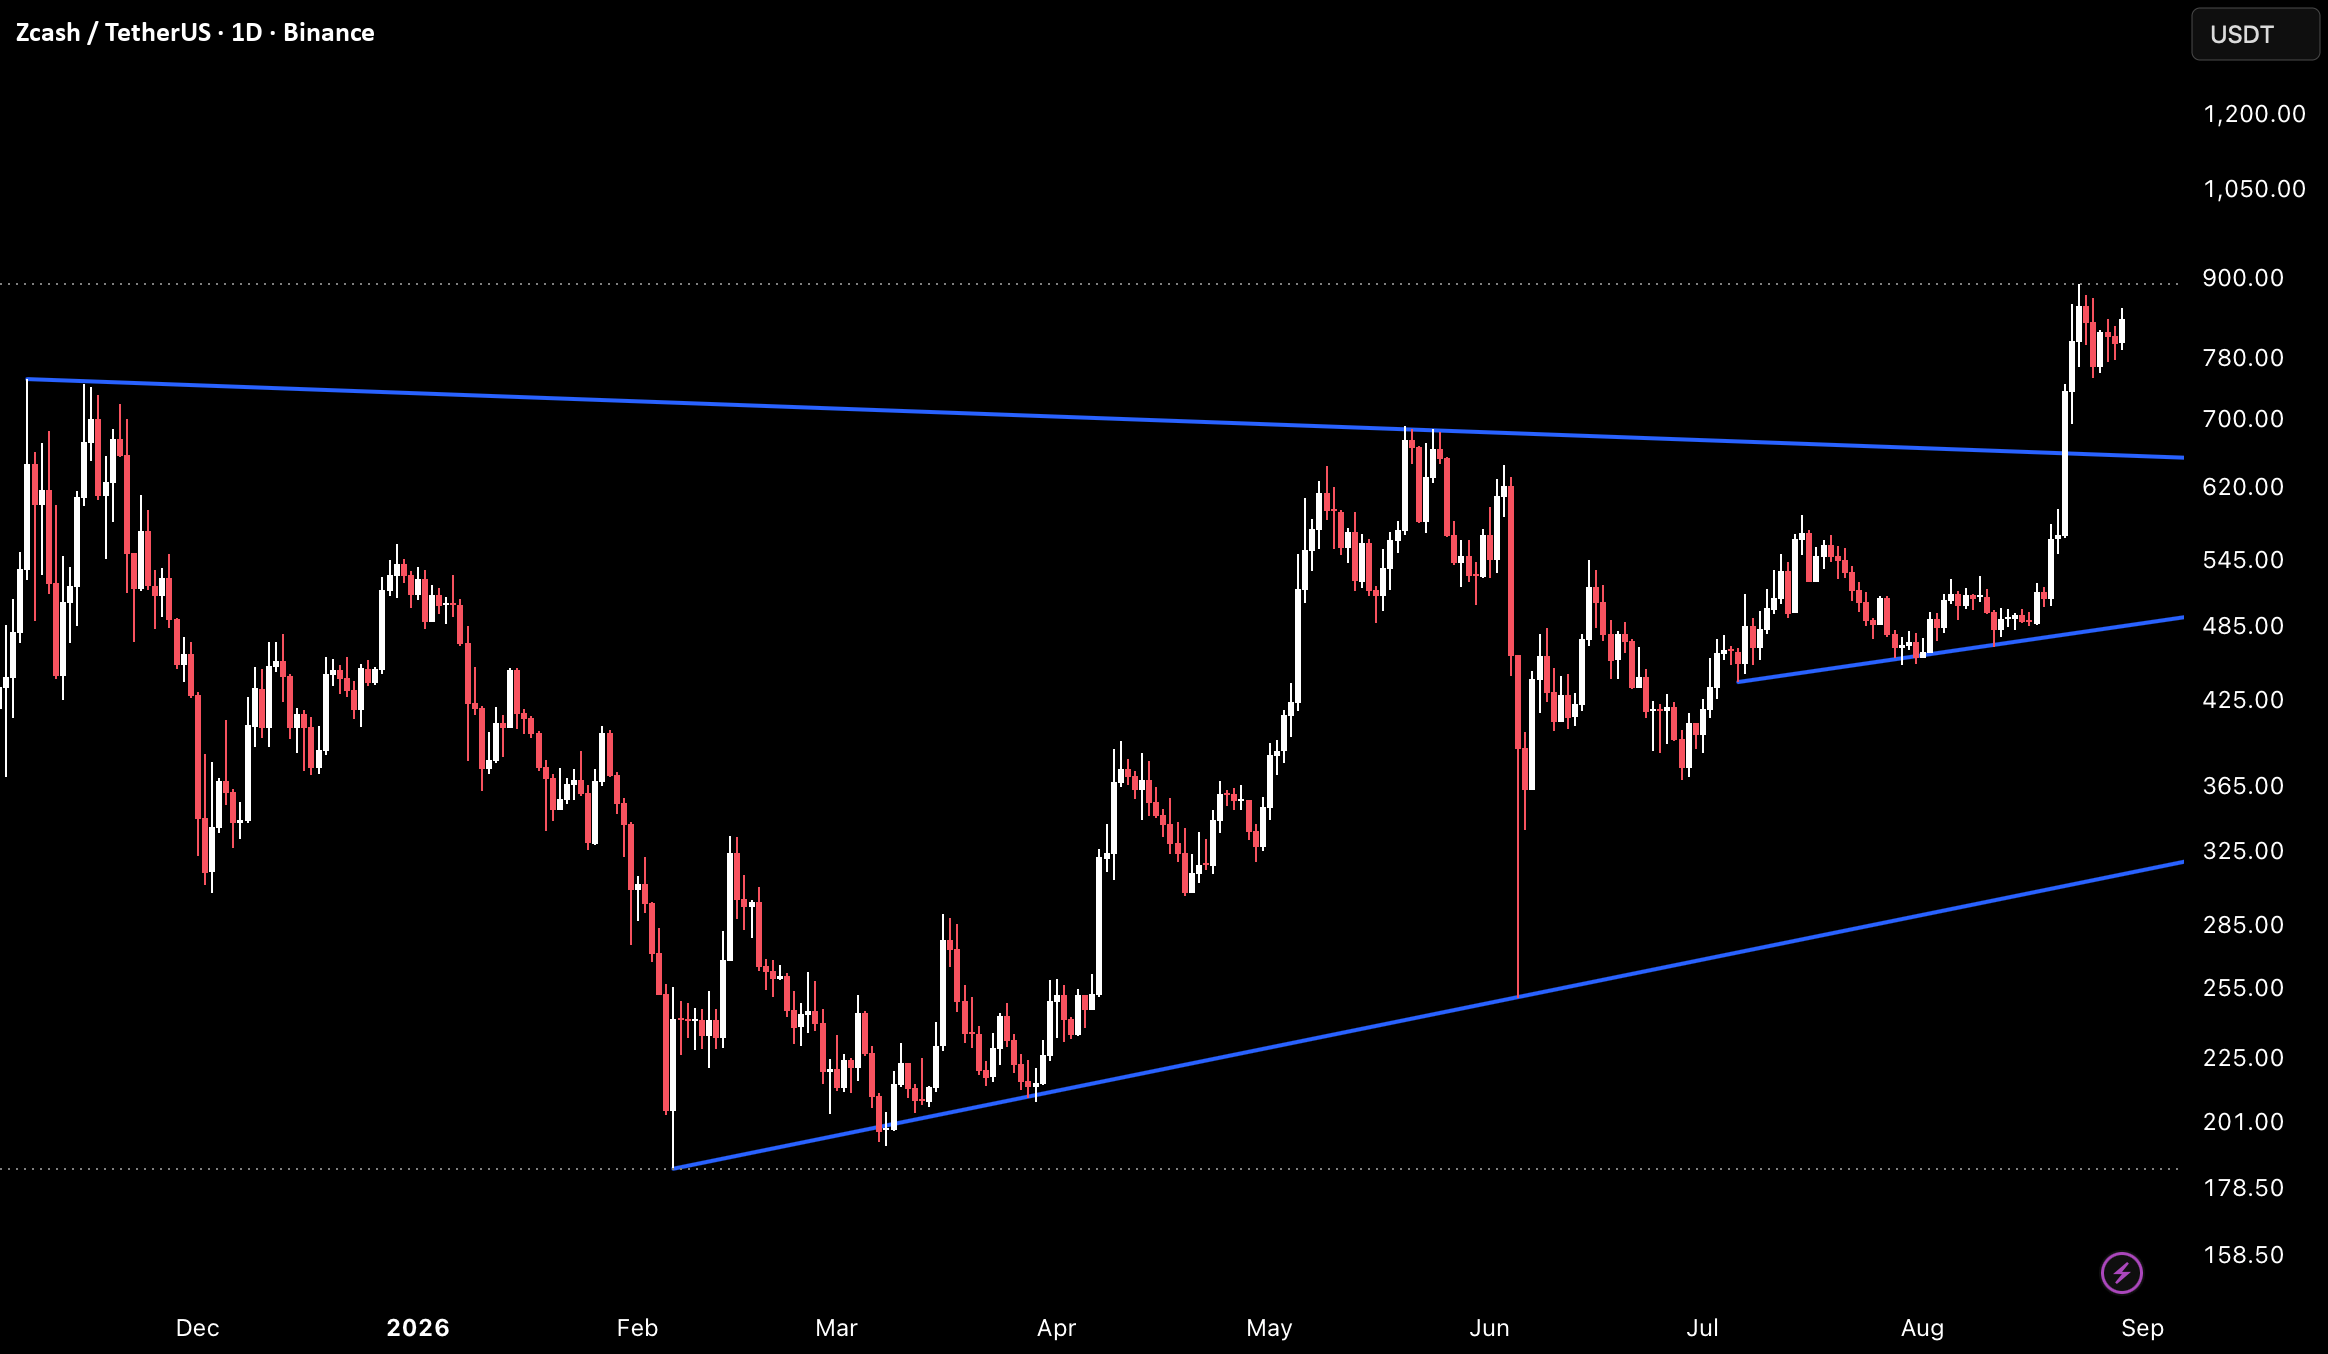
 ZEC is currently trading on the 1D timeframe around 833.17 after reaching all targets from the previous symmetrical breakout idea from a triangle, where prices quickly rose from the upper trendline near 645–660 up to a new all-time high near 900 before pulling back to the 780–833 range, which now has become the first meaningful support after the breakout.
The previous idea identified a symmetrical triangle over a nine-month span, and the breakout above the falling upper trendline near 645–660 as the main structural development. Prices fully confirmed this breakout, reaching the peak around 900 and setting a new historical high before sellers pushed price back inside the current consolidation range. The falling upper trendline broken near 645–660 remains a major structural support floor for any deeper pullback, while the horizontal level near 780–800 appeared as the first reference inside the current consolidation range. The rising lower trendline from the February low continues to climb, reaching the 325–365 area and remains far away as a major structural anchor. Now, two key horizontal reference levels define the post-breakout range: one near 780–800 as the current bottom, and the other near 900 as the ceiling of the recorded historical peak by the wick peak.
Price reached all the specified targets from the previous idea, and it is now in the post-breakout consolidation phase. The main question is whether 780–800 will remain a new support base or whether the correction will move downward toward the broken downtrend line near 645–660.
Most important levels to watch
→ 900–920 is the historical peak zone, a key resistance above it
→ 833–850 current price range, minor resistance
→ 780–800 horizontal support, post-breakout floor
→ 720–740 secondary support, previous post-breakout consolidation
→ 645–660 broken falling upper trendline, macro support
→ 535–595 former resistance zone, deeper support
→ 325–365 rising lower trendline, macro structural floor (dynamic)
If there is consolidation above 780–800 and a recovery toward 833–850, then it will preserve the consolidation structure after the breakout and reopen the possibility of a move toward the historical peak zone near 900–920, potentially reaching the highs if momentum continues.
If there is a loss of the 780–800 zone and a pullback toward 720–740, then the post-breakout correction will extend. A confirmed daily close below the broken downtrend line near 645–660 will be the first sign of breakout failure, reopening the risk of a full retreat toward 535–595.
All previous targets have been reached, and price is consolidating below the historical peak. Keep 780–800 → healthy consolidation, and focus on 900–920. Lose 780 → a correction extends, and the broken trendline near 645–660 is the macro pivot level. Bullish bias above the broken trendline. Change only on a confirmed close below 645–660.

#YenPasses160PerDollarToOneMonthLow #NYSilverFuturesDrop3% #SchwabPlansToAddSOLAVAXLINKTrading #USShortTermTreasuryYieldsJump #TrumpSaysUSReachedVenezuelaOilDeal