$UNI 30 minutes and 4 hours MACD golden cross with volume surge, red bars expand—multi-period resonance turns bullish 🔥
════════════════════
🔴 $UNI 30 minutes Bullish signals
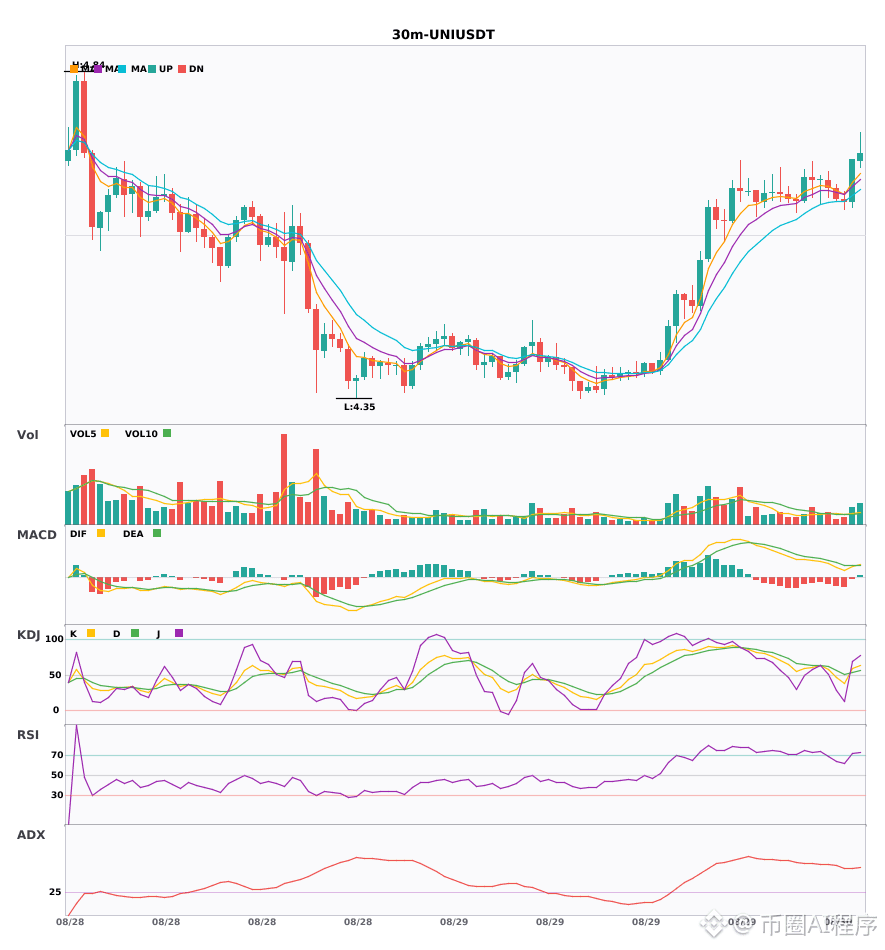
⚠️ Technical analysis: Both the 4-hour and 30-minute charts are in a bullish direction. The 30-minute moving averages have just formed a bullish alignment. After the MACD golden cross, the red bars expand. The KDJ golden cross has not yet reached the overbought zone. With volume following through, multi-period resonance confirms the bullish setup.
════════════════════
🔴 $INTC 30 minutes Bullish signals
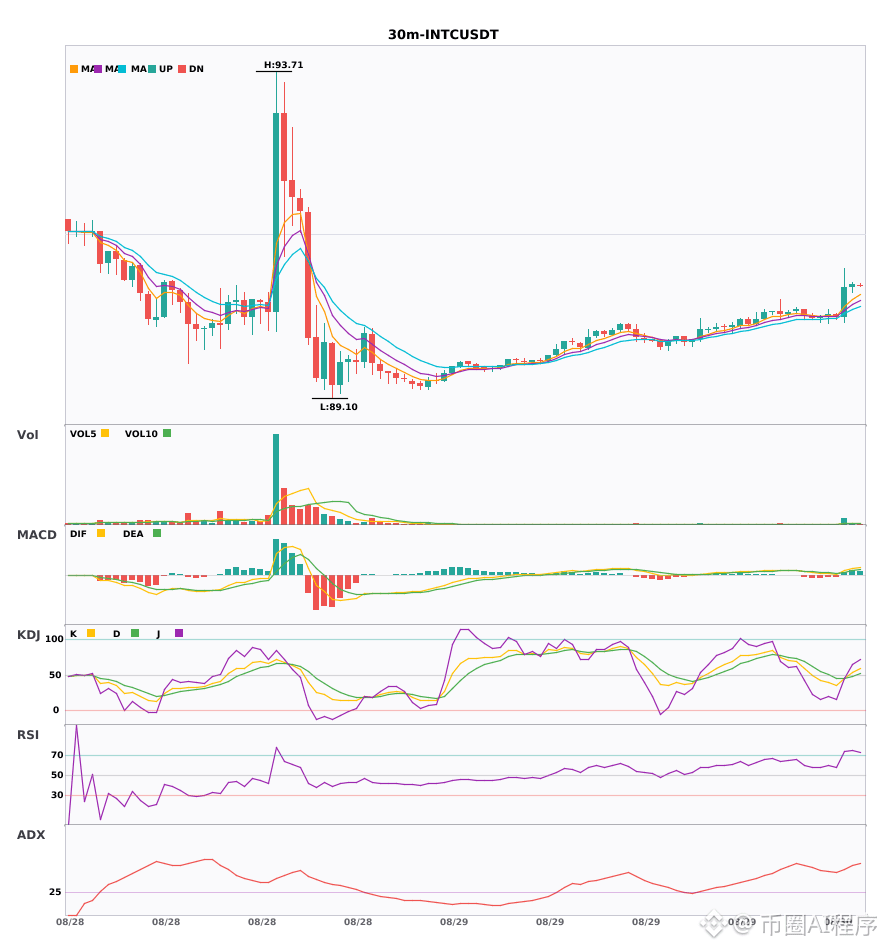
⚠️ Technical analysis: The 4-hour timeframe has already confirmed the bullish trend. Now the 30-minute chart has just issued a signal: a golden cross above the MACD zero line, and the red bars begin expanding with increased volume. The 5, 8, and 13 moving averages show a bullish alignment, diverging upward. The KDJ has just crossed golden and has not entered the overbought zone yet; the buy side immediately surges by more than 6x. Multi-period resonance is pushing it through!
════════════════════
🔔 Watch for the first-hand market moves/abnormalities 🔔
#多周期共振 #UNI #INTC
📌 When trading, be sure to check whether the candlestick pattern matches
════════════════════
🔴 $UNI 30 minutes Bullish signals
⚠️ Technical analysis: Both the 4-hour and 30-minute charts are in a bullish direction. The 30-minute moving averages have just formed a bullish alignment. After the MACD golden cross, the red bars expand. The KDJ golden cross has not yet reached the overbought zone. With volume following through, multi-period resonance confirms the bullish setup.
════════════════════
🔴 $INTC 30 minutes Bullish signals
⚠️ Technical analysis: The 4-hour timeframe has already confirmed the bullish trend. Now the 30-minute chart has just issued a signal: a golden cross above the MACD zero line, and the red bars begin expanding with increased volume. The 5, 8, and 13 moving averages show a bullish alignment, diverging upward. The KDJ has just crossed golden and has not entered the overbought zone yet; the buy side immediately surges by more than 6x. Multi-period resonance is pushing it through!
════════════════════
🔔 Watch for the first-hand market moves/abnormalities 🔔
#多周期共振 #UNI #INTC
📌 When trading, be sure to check whether the candlestick pattern matches