$ETH Crypto-market academician: 8.30 Ethereum (ETH) trend is not over yet, but the groundwork for a pullback has already quietly been laid? Latest market analysis reference
Ethereum’s current price is 2445. After surging up, it started to range and grind sideways. Many friends are starting to wonder: has this wave of rally already ended? Should you chase now or should you run? When people see prior highs, they fear a pullback—afraid that once they enter, they’re buying at the top. But they also fear missing out on what comes next. That’s how the market works: greedy during rallies, fearful during consolidation. From the chart, the main bullish trend has not been directly broken, but short-term upward momentum has clearly weakened. At the highs, disagreements have started to appear.
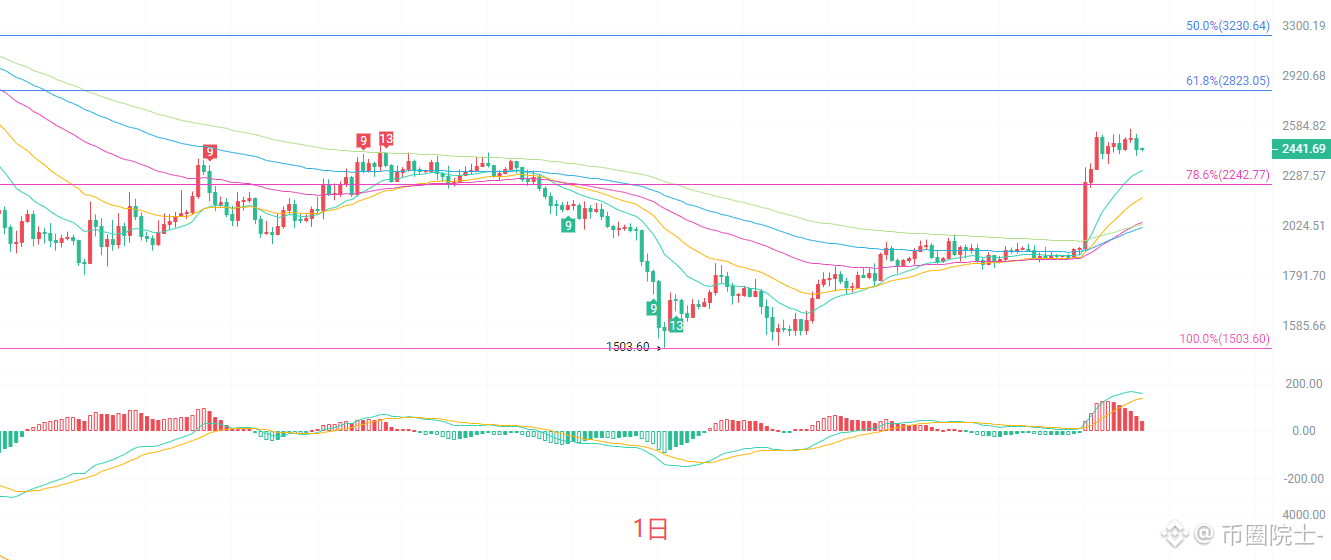
The daily (K-line) chart is currently in a high-level pullback phase. Price has risen above multiple EMA moving averages. The medium- and long-term EMAs are still diverging upward, and the large-scale bullish structure remains intact. The MACD indicator has turned near the high and is curling; the red histogram bars are shrinking continuously, meaning upside momentum is gradually weakening. The Bollinger Bands are opening upward. The current price is pulling back to the inside of the upper band. A key resistance is above at 2566. The first major support is below at 2242—the Fibonacci 78.6% level. On the daily chart there is no clear reversal signal, but there are signs of a bearish divergence at the highs. It’s not suitable to continue chasing. Most likely, the market will enter a consolidation phase to digest, waiting for a directional choice. In terms of execution, it’s best to prioritize waiting for pullback support before planning your entries.
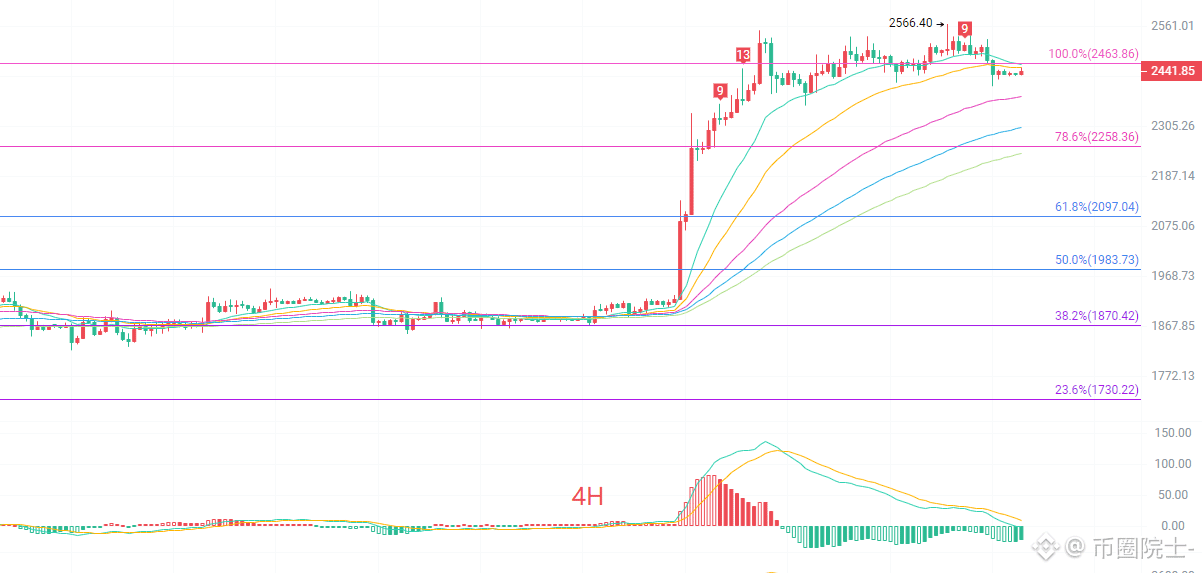
The 4-hour (K-line) chart is pulling back toward nearby short-term EMA moving averages. Short-term EMA15 and EMA30 are still pointing upward, but price has already broken below the fastest short-term moving average, so short-term bulls’ strength is fading. MACD has completed a death cross at the high level and continues outputting green histogram bars, indicating increasing near-term pullback pressure. The Bollinger Bands have started to tighten, suggesting volatility is narrowing and the market is entering a ranging zone. Resistance overhead is at 2463—also the 100% Fibonacci level of this upward leg. The first support below is at 2258. On the 4-hour timeframe, this is a repair phase after the rally. It’s not a complete shift to bearish, and it’s also difficult for another violent surge upward to happen immediately. In the short term, it will keep oscillating back and forth. Bulls and bears will repeatedly contest around here. Don’t chase or panic-sell in the short term—wait until price approaches key support and resistance levels before considering an entry.
Short-term references:
As long as 2300 to 2250 is not broken upward, go long with a stop-loss of 40 points; target 2520 to 2620.
If 2540 to 2560 is not broken downward, go short with a stop-loss of 40 points; target 2500 to 2450.
Specific execution should rely on real-time order book data.
#ETH走势分析
Ethereum’s current price is 2445. After surging up, it started to range and grind sideways. Many friends are starting to wonder: has this wave of rally already ended? Should you chase now or should you run? When people see prior highs, they fear a pullback—afraid that once they enter, they’re buying at the top. But they also fear missing out on what comes next. That’s how the market works: greedy during rallies, fearful during consolidation. From the chart, the main bullish trend has not been directly broken, but short-term upward momentum has clearly weakened. At the highs, disagreements have started to appear.
The daily (K-line) chart is currently in a high-level pullback phase. Price has risen above multiple EMA moving averages. The medium- and long-term EMAs are still diverging upward, and the large-scale bullish structure remains intact. The MACD indicator has turned near the high and is curling; the red histogram bars are shrinking continuously, meaning upside momentum is gradually weakening. The Bollinger Bands are opening upward. The current price is pulling back to the inside of the upper band. A key resistance is above at 2566. The first major support is below at 2242—the Fibonacci 78.6% level. On the daily chart there is no clear reversal signal, but there are signs of a bearish divergence at the highs. It’s not suitable to continue chasing. Most likely, the market will enter a consolidation phase to digest, waiting for a directional choice. In terms of execution, it’s best to prioritize waiting for pullback support before planning your entries.
The 4-hour (K-line) chart is pulling back toward nearby short-term EMA moving averages. Short-term EMA15 and EMA30 are still pointing upward, but price has already broken below the fastest short-term moving average, so short-term bulls’ strength is fading. MACD has completed a death cross at the high level and continues outputting green histogram bars, indicating increasing near-term pullback pressure. The Bollinger Bands have started to tighten, suggesting volatility is narrowing and the market is entering a ranging zone. Resistance overhead is at 2463—also the 100% Fibonacci level of this upward leg. The first support below is at 2258. On the 4-hour timeframe, this is a repair phase after the rally. It’s not a complete shift to bearish, and it’s also difficult for another violent surge upward to happen immediately. In the short term, it will keep oscillating back and forth. Bulls and bears will repeatedly contest around here. Don’t chase or panic-sell in the short term—wait until price approaches key support and resistance levels before considering an entry.
Short-term references:
As long as 2300 to 2250 is not broken upward, go long with a stop-loss of 40 points; target 2520 to 2620.
If 2540 to 2560 is not broken downward, go short with a stop-loss of 40 points; target 2500 to 2450.
Specific execution should rely on real-time order book data.
#ETH走势分析