$BTC Bitcoin Circle Academician: August 30 BTC surges up then meets resistance and falls back—analyzing the chip rotation logic behind this round of rally? Latest market analysis and operational suggestions
Bitcoin’s current price is 77,800. After pushing higher, it has entered a tug-of-war phase. Many friends, seeing a big rally, can’t wait to chase; then they get tormented by whipsawing and range-trading. After a surge, don’t blindly look bullish, and don’t immediately flip to bearish. The market won’t just go straight up in one direction. Pullbacks and shakeouts in between are normal. At 77,800, divergence at the high level has already appeared, and the risk of chasing higher is growing. Many people get dazzled by short-term big bullish candles and ignore the destructive power of pullbacks
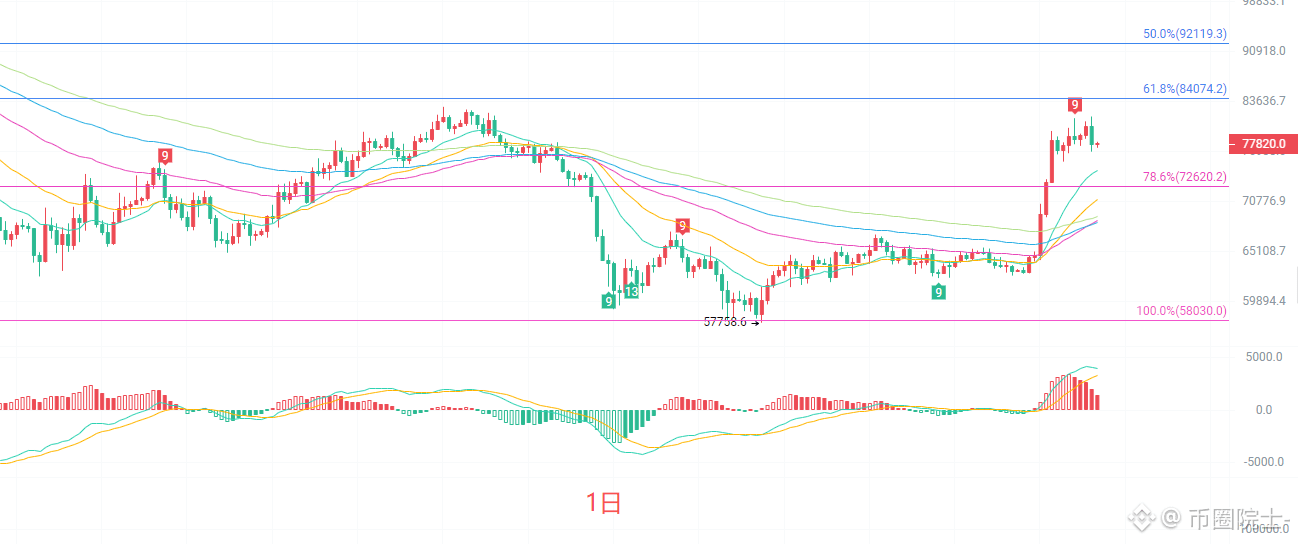
The daily K-line remains above all mid- to long-term EMA moving averages, and the higher-level bullish structure hasn’t been broken. The MACD indicator has turned down from the high level, with the red histogram shrinking continuously. The upper band of the Bollinger Bands is under pressure and rolling over, indicating that sell pressure from above is gradually being released. The 78.6% Fibonacci level at 73,890 becomes a key support below. On the daily chart, this is a consolidation and correction at a high level after a big move up—not a direct turn to bearish. The short-term resistance is 81,500; only if it breaks again will the bullish assault resume. If key support is broken, the pullback room for this rally will open further. For the larger cycle, we need to observe how strongly support holds
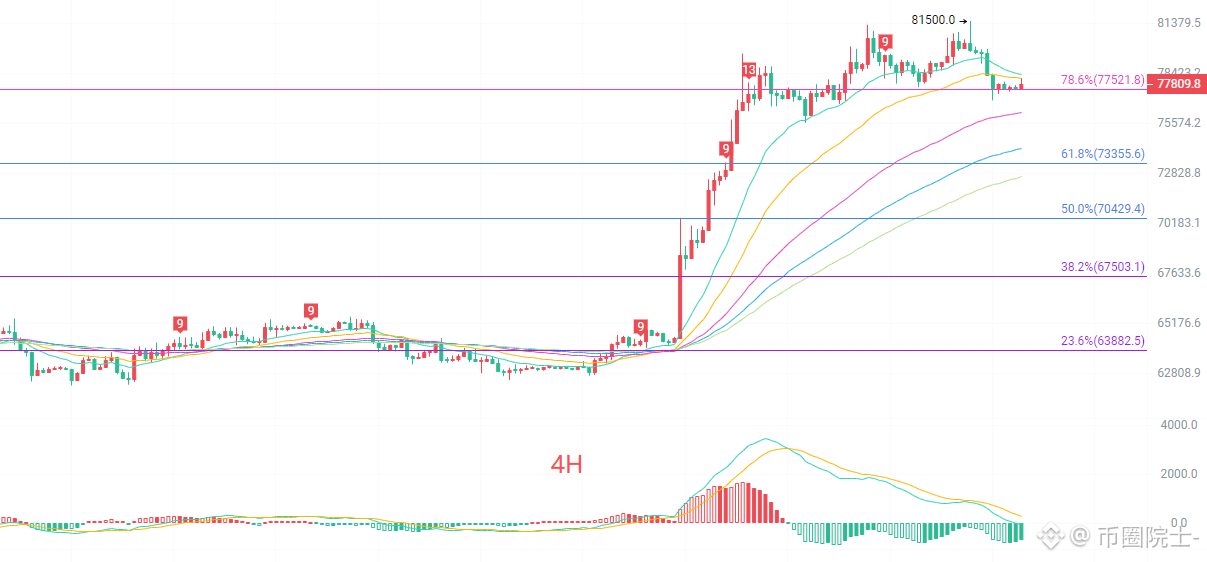
The 4-hour K-line has already broken below the short-term EMA15 and EMA30. The 4-hour MACD’s two lines keep moving downward; the green histogram keeps expanding, and bullish momentum is clearly weakening. The Bollinger Bands price has fallen from the upper trajectory and is now hovering near the middle band, meaning the short-term market has entered an adjustment period. 77,521 is the 78.6% Fibonacci key level, and the market is currently fighting around it. For bulls to regain strength, they need to reclaim above 79,500; if support fails, it will further probe down toward 73,355. The 4-hour timeframe is currently in the pullback phase after a bullish run. In the short term, it’s more range-bound and slightly weak—don’t rush to bottom-fish; wait for confirmation signals
Short-term reference:
Buy-side: from 76,800 to 76,400 (northbound), stop-loss 76,000; target 79,500 to 81,200
Sell-side: from 80,000 to 81,000 (southbound), stop-loss 81,500; target 79,000 to 78,000
Specific execution should rely on real-time order book data. For more information, you can check what the author shares. The article has a publishing delay. Suggestions are for reference only—risk is your own responsibility
#BTC走势分析
Bitcoin’s current price is 77,800. After pushing higher, it has entered a tug-of-war phase. Many friends, seeing a big rally, can’t wait to chase; then they get tormented by whipsawing and range-trading. After a surge, don’t blindly look bullish, and don’t immediately flip to bearish. The market won’t just go straight up in one direction. Pullbacks and shakeouts in between are normal. At 77,800, divergence at the high level has already appeared, and the risk of chasing higher is growing. Many people get dazzled by short-term big bullish candles and ignore the destructive power of pullbacks
The daily K-line remains above all mid- to long-term EMA moving averages, and the higher-level bullish structure hasn’t been broken. The MACD indicator has turned down from the high level, with the red histogram shrinking continuously. The upper band of the Bollinger Bands is under pressure and rolling over, indicating that sell pressure from above is gradually being released. The 78.6% Fibonacci level at 73,890 becomes a key support below. On the daily chart, this is a consolidation and correction at a high level after a big move up—not a direct turn to bearish. The short-term resistance is 81,500; only if it breaks again will the bullish assault resume. If key support is broken, the pullback room for this rally will open further. For the larger cycle, we need to observe how strongly support holds
The 4-hour K-line has already broken below the short-term EMA15 and EMA30. The 4-hour MACD’s two lines keep moving downward; the green histogram keeps expanding, and bullish momentum is clearly weakening. The Bollinger Bands price has fallen from the upper trajectory and is now hovering near the middle band, meaning the short-term market has entered an adjustment period. 77,521 is the 78.6% Fibonacci key level, and the market is currently fighting around it. For bulls to regain strength, they need to reclaim above 79,500; if support fails, it will further probe down toward 73,355. The 4-hour timeframe is currently in the pullback phase after a bullish run. In the short term, it’s more range-bound and slightly weak—don’t rush to bottom-fish; wait for confirmation signals
Short-term reference:
Buy-side: from 76,800 to 76,400 (northbound), stop-loss 76,000; target 79,500 to 81,200
Sell-side: from 80,000 to 81,000 (southbound), stop-loss 81,500; target 79,000 to 78,000
Specific execution should rely on real-time order book data. For more information, you can check what the author shares. The article has a publishing delay. Suggestions are for reference only—risk is your own responsibility
#BTC走势分析