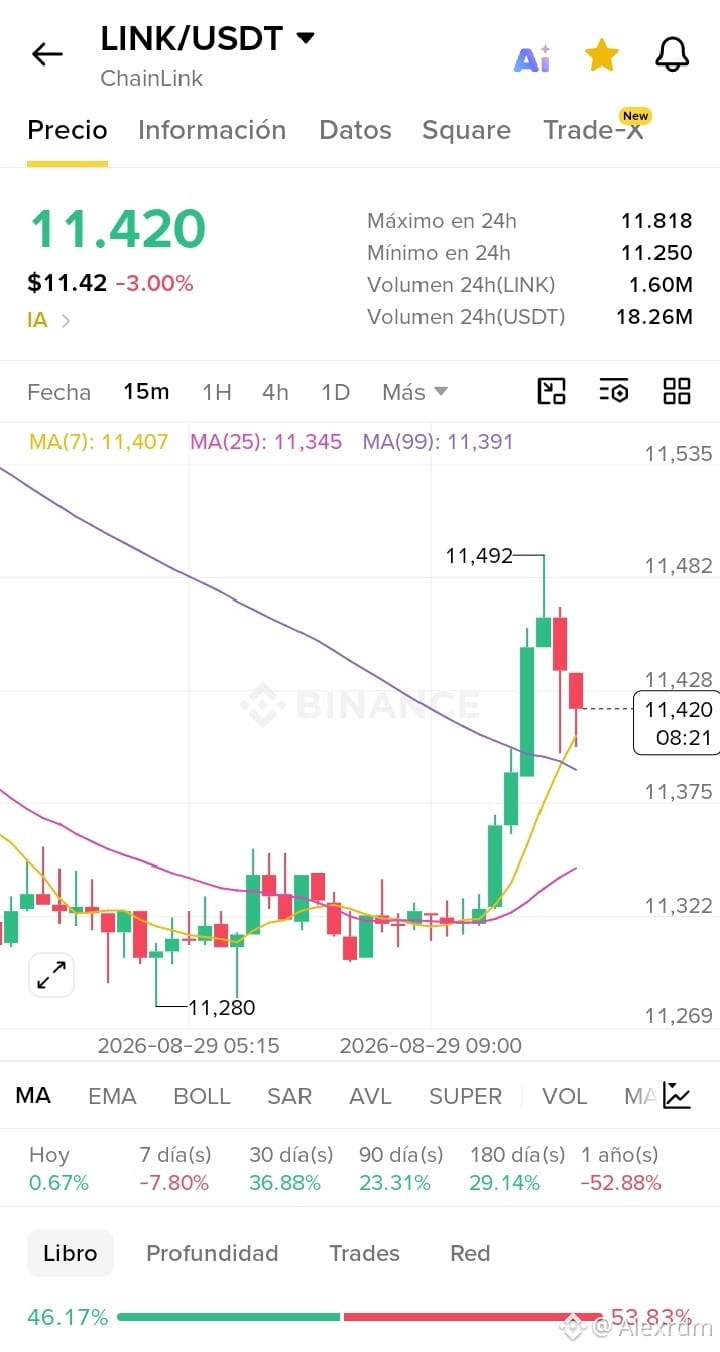
Chart Diagnosis ($LINK /USDT 15m - $11.420)
Relevant Break: The price managed to do what we needed for the structure: cross above the three dynamic moving averages. The MA(7) rose to $11.407 and the MA(99) lagged behind at $11.391.
Healthy Retest: The current red candle at $11.420 is a normal correction after the spike to $11.492. It’s aiming to complete the defensive retest exactly over the MA(7) ($11.407) to validate support.
Order Book: It’s slightly tilted toward sell orders (53.83% Offer vs. 46.17% Demand), indicating that the zone near $11.50 has a quick take-profit wall.
Trading Scenarios:
Re-entry Scenario (Scalping): If the developing 15m candle closes holding the $11.40 floor (above the MA(7)), the structure confirms strength to seek a second impulse toward $11.52 – $11.58.
Rebound Invalidation: If it loses $11.38 with a candle close, it would absorb the breakout green candle and return to the boring $11.30 range.
$NVDAB $BTC
Relevant Break: The price managed to do what we needed for the structure: cross above the three dynamic moving averages. The MA(7) rose to $11.407 and the MA(99) lagged behind at $11.391.
Healthy Retest: The current red candle at $11.420 is a normal correction after the spike to $11.492. It’s aiming to complete the defensive retest exactly over the MA(7) ($11.407) to validate support.
Order Book: It’s slightly tilted toward sell orders (53.83% Offer vs. 46.17% Demand), indicating that the zone near $11.50 has a quick take-profit wall.
Trading Scenarios:
Re-entry Scenario (Scalping): If the developing 15m candle closes holding the $11.40 floor (above the MA(7)), the structure confirms strength to seek a second impulse toward $11.52 – $11.58.
Rebound Invalidation: If it loses $11.38 with a candle close, it would absorb the breakout green candle and return to the boring $11.30 range.
$NVDAB $BTC