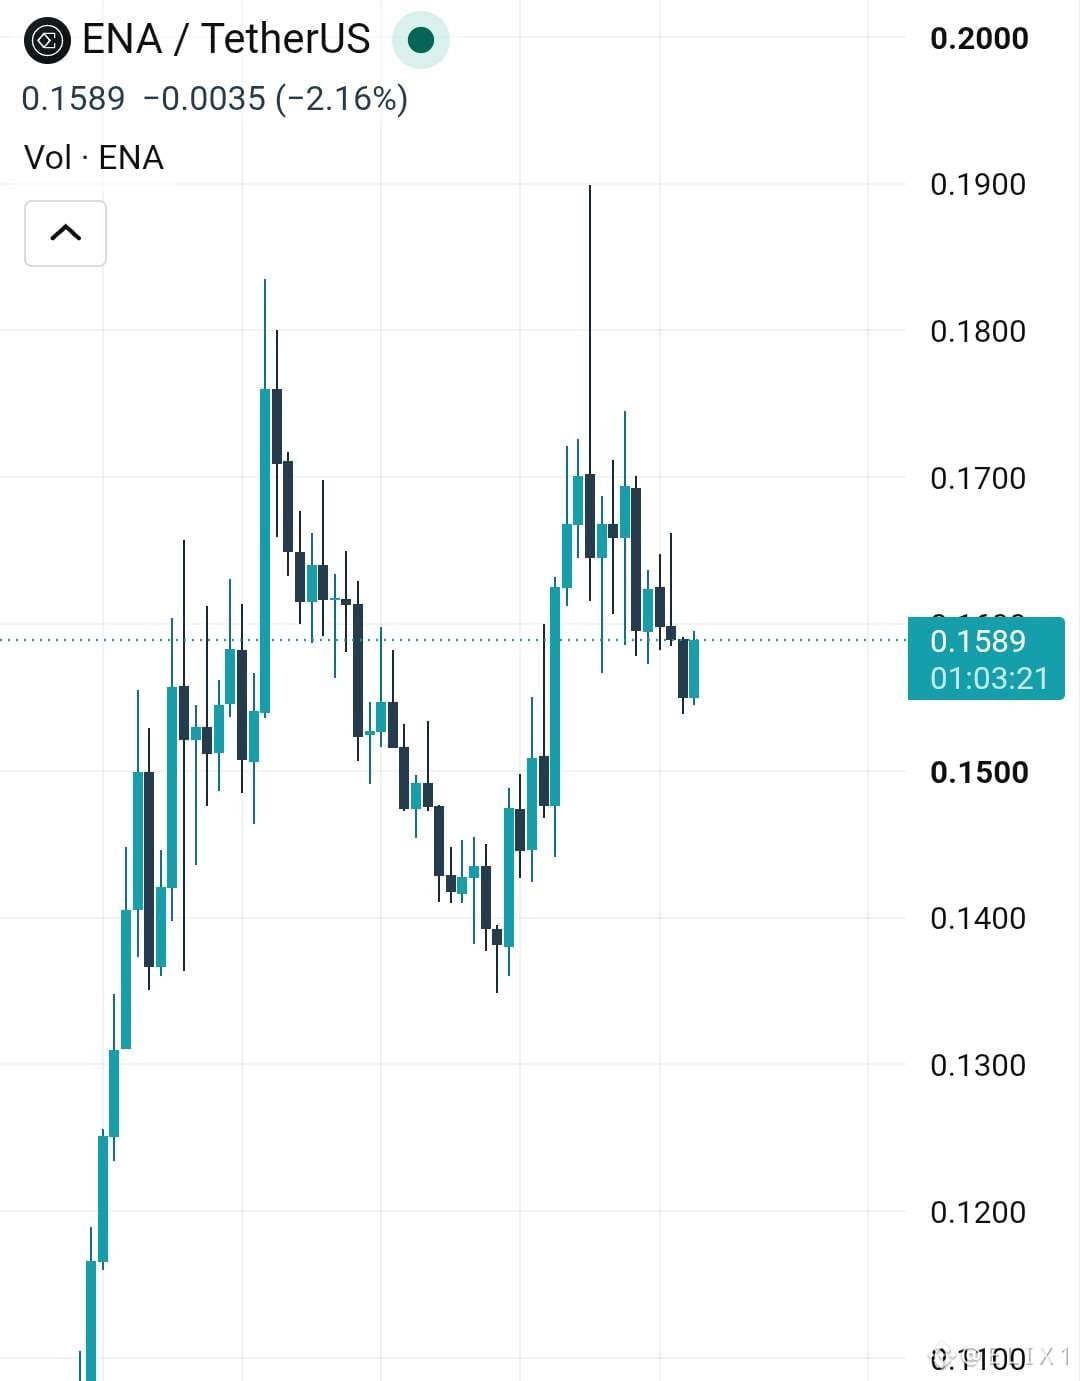
$ENA is trading inside a healthy consolidation after an impulsive rally. Despite recent selling pressure, bulls continue defending the $0.155–0.158 demand zone, suggesting buyers are still active.
Chart Structure
Higher lows remain intact, keeping the short-term bullish structure alive.
Price is compressing below resistance, often a sign that volatility is building.
The long upper wick near $0.19 marks a liquidity grab—not necessarily a trend reversal.
Key Levels
• Support: $0.155 → $0.150
• Resistance: $0.165 → $0.170
Bullish Scenario:
A decisive close above $0.165 could trigger momentum toward $0.175–0.180.
Bearish Scenario:
Losing $0.155 opens the door for a retest of $0.150, where stronger demand is expected.
Bottom Line:
This isn't a chart to chase—it's a chart to watch. Consolidation after a strong move often decides the direction of the next major trend. The breakout from this range is likely to set the tone for $ENA's next significant move.
Not financial advice. Always manage your risk.
#ENA #Crypto #Altcoins #TechnicalAnalysis
Chart Structure
Higher lows remain intact, keeping the short-term bullish structure alive.
Price is compressing below resistance, often a sign that volatility is building.
The long upper wick near $0.19 marks a liquidity grab—not necessarily a trend reversal.
Key Levels
• Support: $0.155 → $0.150
• Resistance: $0.165 → $0.170
Bullish Scenario:
A decisive close above $0.165 could trigger momentum toward $0.175–0.180.
Bearish Scenario:
Losing $0.155 opens the door for a retest of $0.150, where stronger demand is expected.
Bottom Line:
This isn't a chart to chase—it's a chart to watch. Consolidation after a strong move often decides the direction of the next major trend. The breakout from this range is likely to set the tone for $ENA's next significant move.
Not financial advice. Always manage your risk.
#ENA #Crypto #Altcoins #TechnicalAnalysis