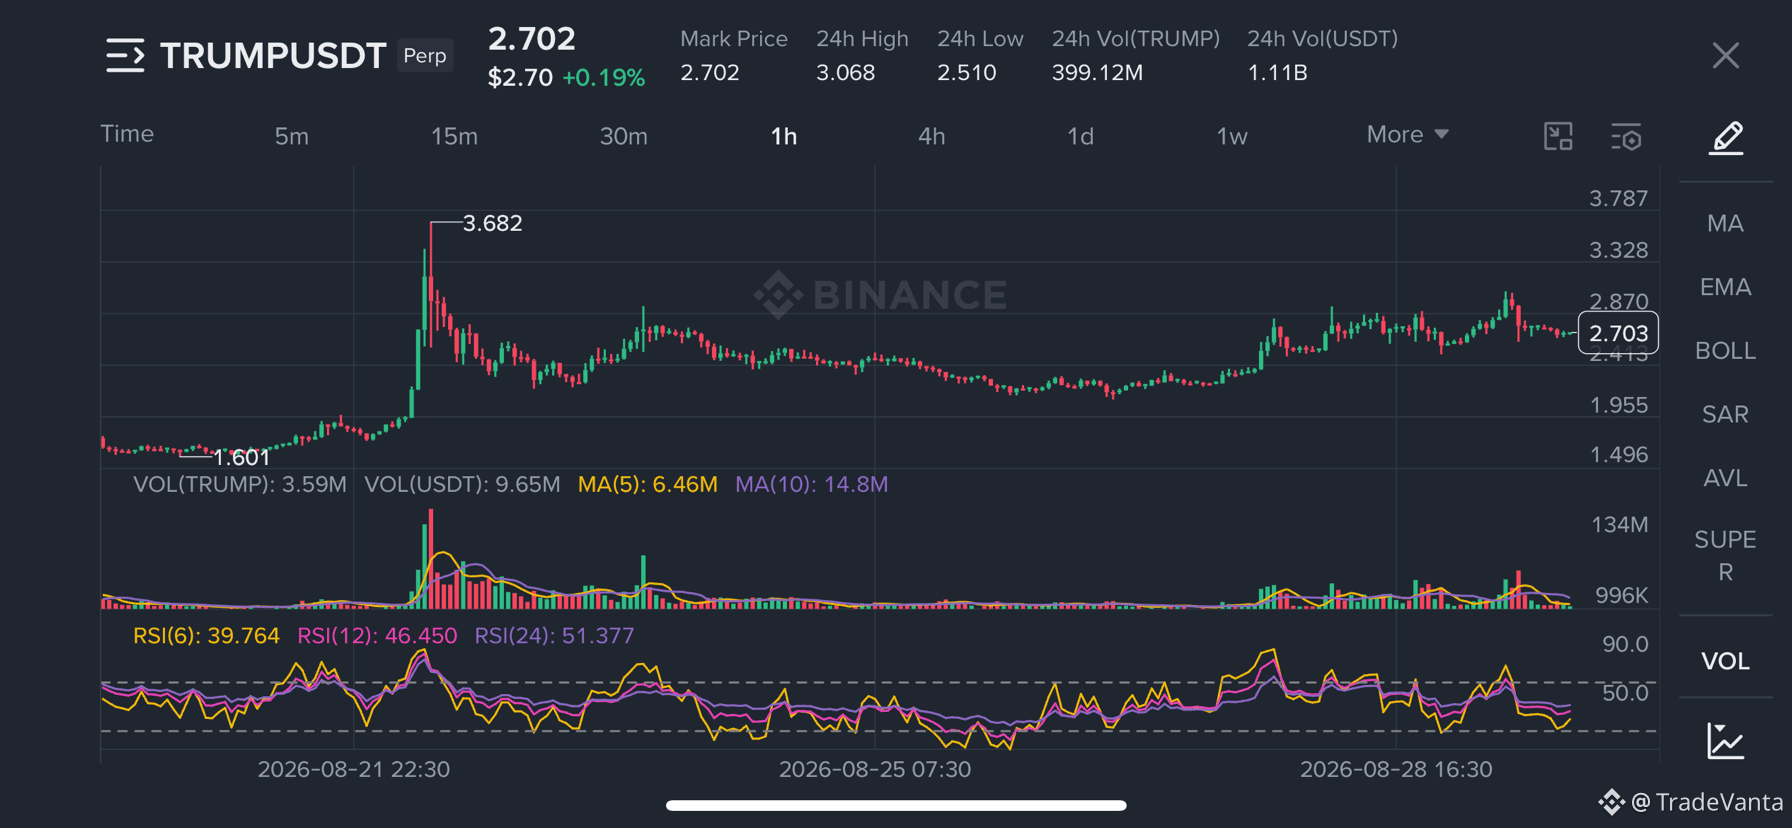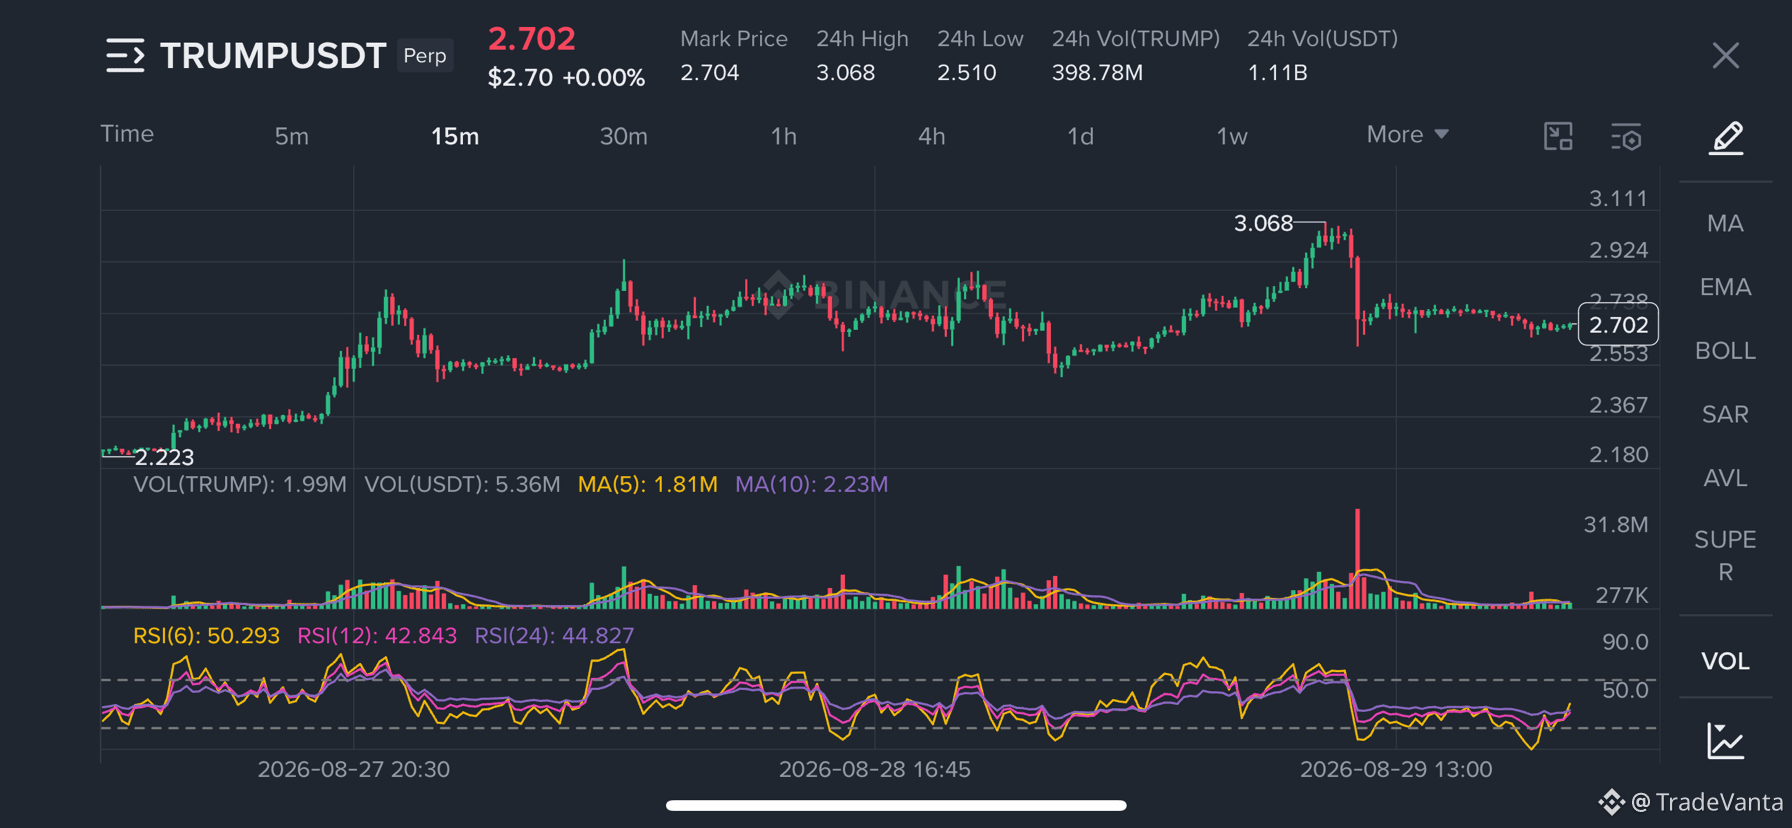
$TRUMP chart is a perfect example of what happens after a violent crypto breakout. TRUMPUSDT jumped from around $1.36 to a 4h high near $3.68, then cooled off into a much wider consolidation range.
Now price sits around $2.70, with the 24h range between $2.51 and $3.07. The interesting part is the contrast across timeframes: the daily RSI remains elevated around 73, while the 1h RSI is much weaker. That suggests the bigger move is still fresh, but short-term momentum has already cooled.
Volume exploded during the breakout and has since faded considerably. 📉
The lesson? After a move this aggressive, patience can be more valuable than chasing the next candle. Watch whether TRUMP can build strength around the current range before assuming the breakout is ready to continue.
#trump #Trump's #Write2Earn
Now price sits around $2.70, with the 24h range between $2.51 and $3.07. The interesting part is the contrast across timeframes: the daily RSI remains elevated around 73, while the 1h RSI is much weaker. That suggests the bigger move is still fresh, but short-term momentum has already cooled.
Volume exploded during the breakout and has since faded considerably. 📉
The lesson? After a move this aggressive, patience can be more valuable than chasing the next candle. Watch whether TRUMP can build strength around the current range before assuming the breakout is ready to continue.
#trump #Trump's #Write2Earn