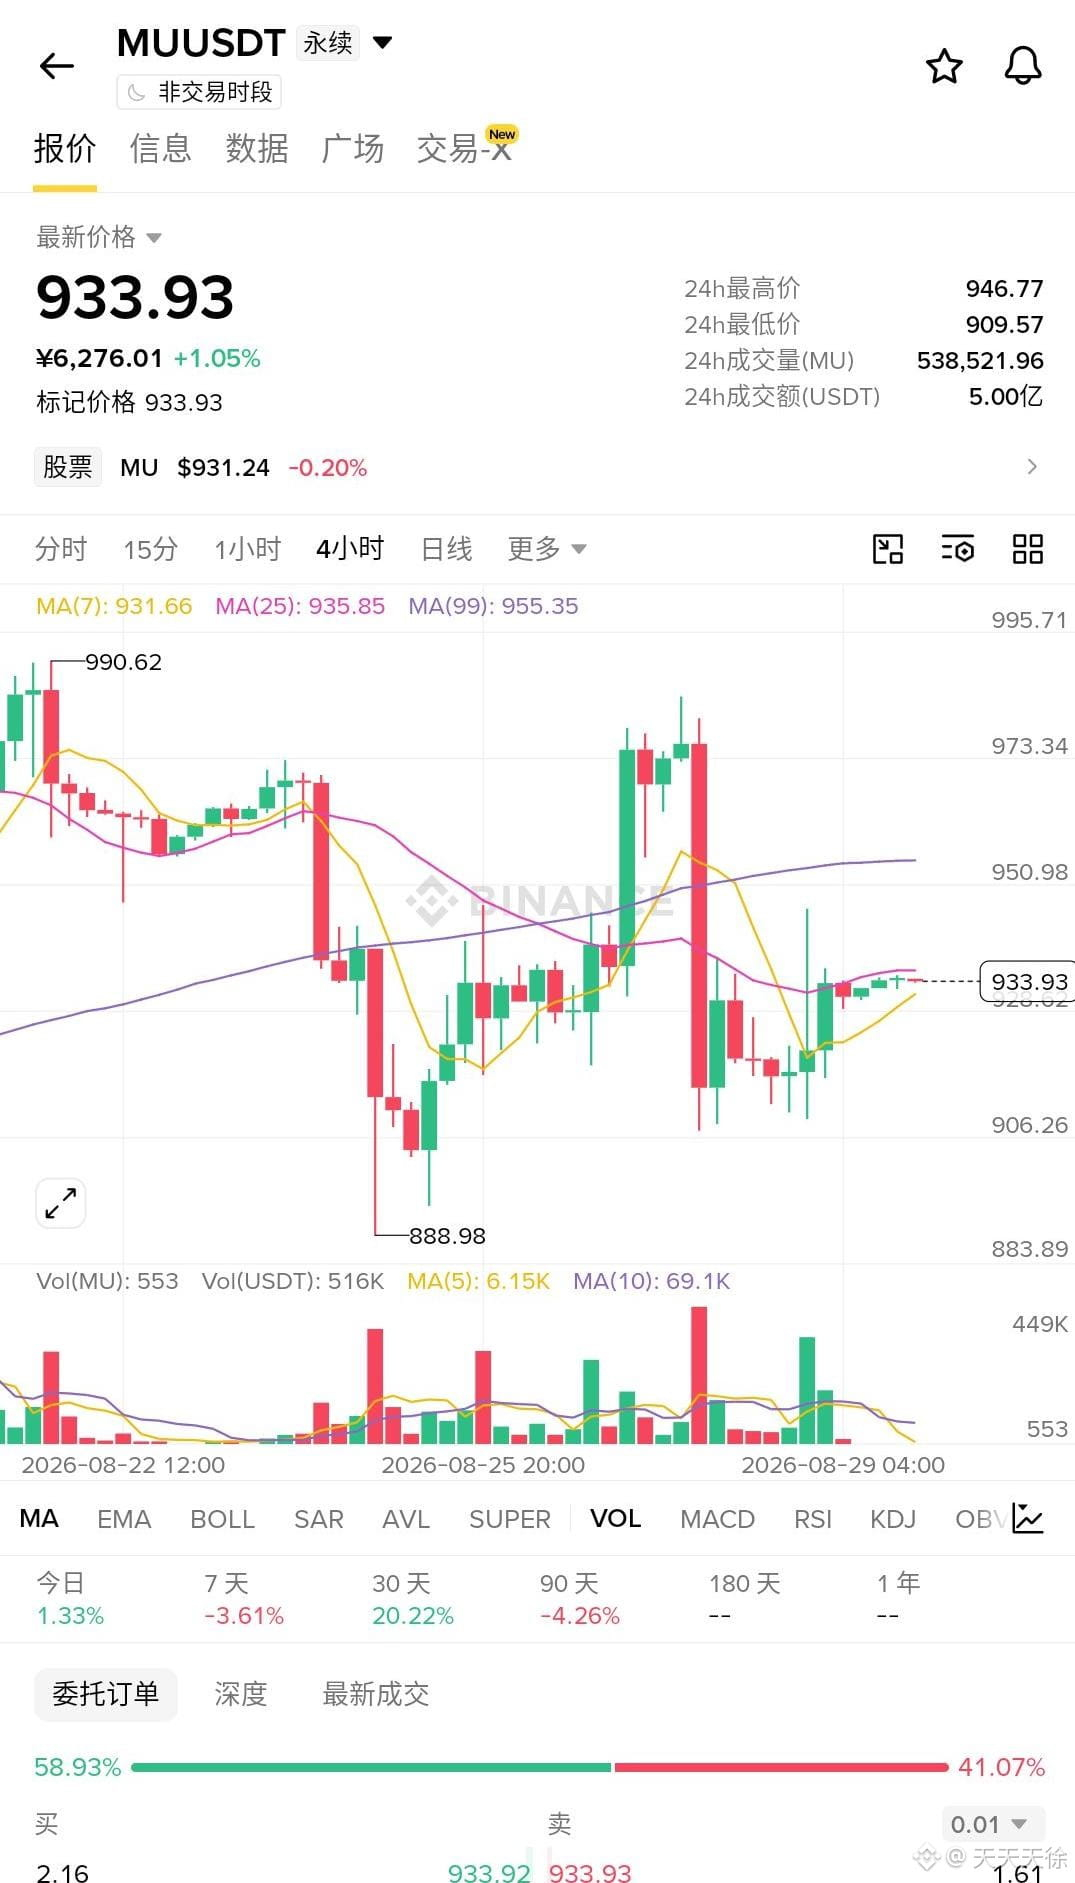
MU stayed sideways all day at this level around 934. It looks calm and doesn’t seem to have much “temper,” but behind it there’s a 7-hour active buy order that flipped to 2.4 times—buys make up 57.5%, the taker long/short ratio is 1.36. Money is squeezing in aggressively, yet the price doesn’t budge. The intraday high at 946–947 overhead looks like a wall.
Why is it so aggressive but still can’t break through? First, understand where the money is coming from: in the past 24 hours, contract open interest was cut by 16.78%. That low at 910 is the liquidation point of panicked longs. After the leverage gets cleaned out, the active buy orders pouring in now are fresh money—not late-stage buyers chasing the highs.
At this moment the funding/fee rate is effectively zero, and the 8-period average is only 0.0089%. The market still hasn’t warmed up after the liquidation—adding to longs doesn’t require “topping up” (paying the carry), and this is completely different from the frustration of failing to break the day’s high. On the spot order book, the buy wall on levels 20 is 1.06x (slightly thin). Whale accounts dropped 7.8% in equity over 7 hours, but their position changed only 0.45%—the bulk is still pressing long positions.
Conclusion: go long. MU has been trading tight against the 20/50 moving averages at 934 for a day. The 4-hour chart shows 5 bullish candles and 1 bearish candle. A breakout above 946–947 should trigger acceleration. Targets: above the day’s high. Stop loss: below 930.
Reversal conditions: after a false breakout above the day’s high, if active sell orders begin to outweigh and take control; or if price falls back to 930 and open interest continues shrinking—then it means this wave of buying is a bull trap, and you should flip to short immediately. #mu $MU
Why is it so aggressive but still can’t break through? First, understand where the money is coming from: in the past 24 hours, contract open interest was cut by 16.78%. That low at 910 is the liquidation point of panicked longs. After the leverage gets cleaned out, the active buy orders pouring in now are fresh money—not late-stage buyers chasing the highs.
At this moment the funding/fee rate is effectively zero, and the 8-period average is only 0.0089%. The market still hasn’t warmed up after the liquidation—adding to longs doesn’t require “topping up” (paying the carry), and this is completely different from the frustration of failing to break the day’s high. On the spot order book, the buy wall on levels 20 is 1.06x (slightly thin). Whale accounts dropped 7.8% in equity over 7 hours, but their position changed only 0.45%—the bulk is still pressing long positions.
Conclusion: go long. MU has been trading tight against the 20/50 moving averages at 934 for a day. The 4-hour chart shows 5 bullish candles and 1 bearish candle. A breakout above 946–947 should trigger acceleration. Targets: above the day’s high. Stop loss: below 930.
Reversal conditions: after a false breakout above the day’s high, if active sell orders begin to outweigh and take control; or if price falls back to 930 and open interest continues shrinking—then it means this wave of buying is a bull trap, and you should flip to short immediately. #mu $MU