
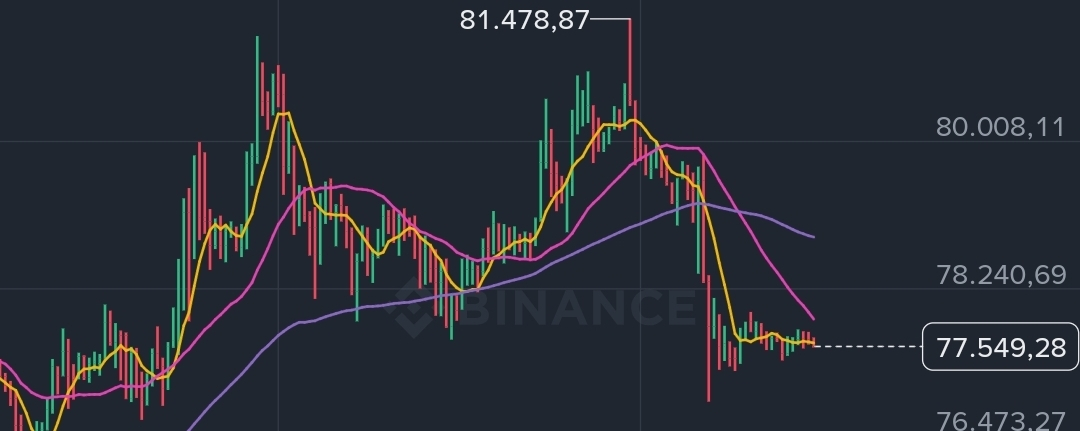

📊 BTC/USDT ANALYSIS SUMMARY (H1 TIMEFRAME) - ASIA/EU SESSION & US SESSION OUTLOOK $BTC
1. ASIA & EUROPE SESSION OVERVIEW:
• Current price: $77,549.28 (slightly down -2.58%).
• Price structure: After forming a short-term peak at $81,478.87, BTC entered a downward adjustment phase (Sideway Down). Currently, the downward momentum is stalling and consolidating around the support zone of $77,500.
• MA indicators: Price has fallen below MA(7) and MA(25). The MA(7) line is sloping downward, creating short-term bearish pressure, but the overall major structure remains above MA(99).
• Volume (VOL): Selling pressure shows signs of gradually exhausting as price approaches the support zone; the bears are no longer as aggressive before the US session opens.
• MACD indicator: Being below the 0 line indicates that the selling side has the upper hand in the short term. However, the red Histogram is shrinking, signaling that selling pressure is weakening and that a technical rebound may appear.
2. STRATEGIC DIRECTION FOR THE US SESSION:
The US session is expected to see strong fluctuations and sweep liquidity. Prioritize observing price action at these two key zones:
• LONG Setup – PRIORITY:
- Waiting zone: $76,500 – $77,000.
- Conditions: Price sweeps downward, followed by a strong pin-bar candle or an upside reversal candle with large Volume.
- Take-profit target (TP): $78,500 – $79,200.
• SELL Setup (SHORT) – SWING TRADING:
- Resistance zone: $78,500 – $79,000 (the overlapping area of the MA lines).
- Conditions: Price rebounds upward first but gets rejected (bearish reversal candle appears).
- Take-profit target (TP): $77,000.
⚠️ WARNING: The US session moves extremely fast—absolutely follow capital management rules, do not use negative DCA, and always set a complete Stop Loss to protect against risks from wick sweeps on both sides.