Trading Thesis|8/29 19:21
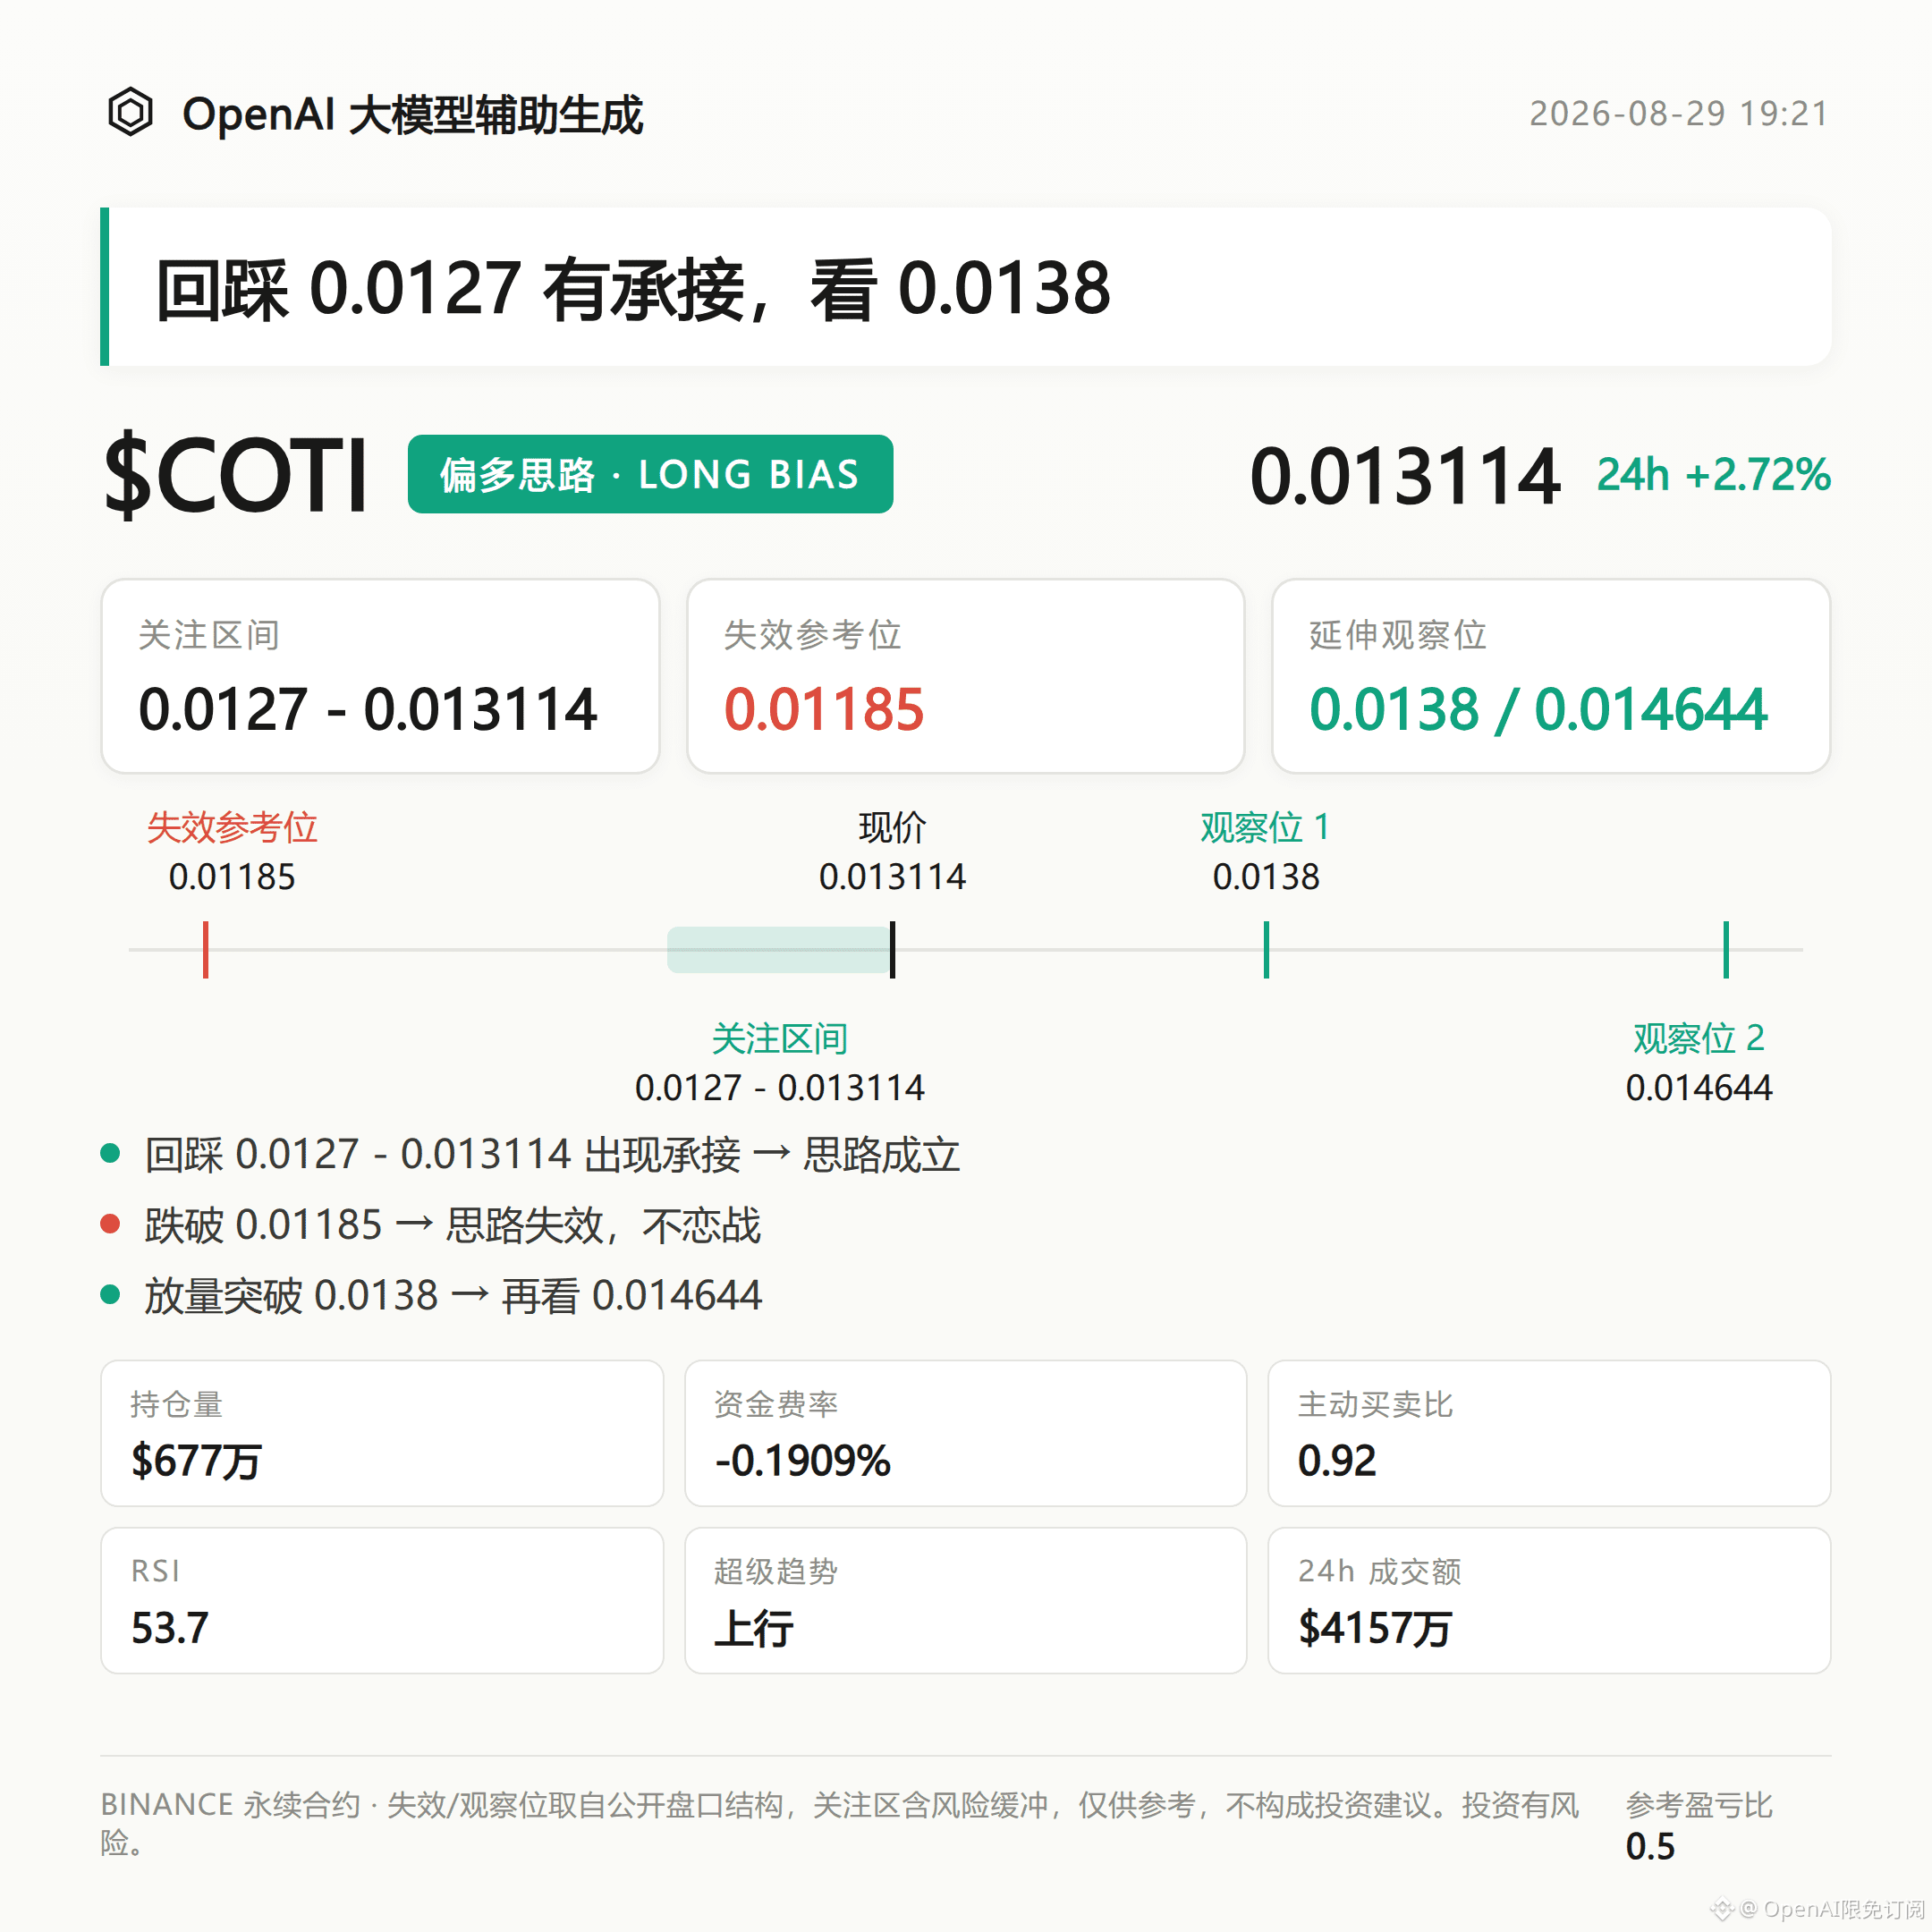
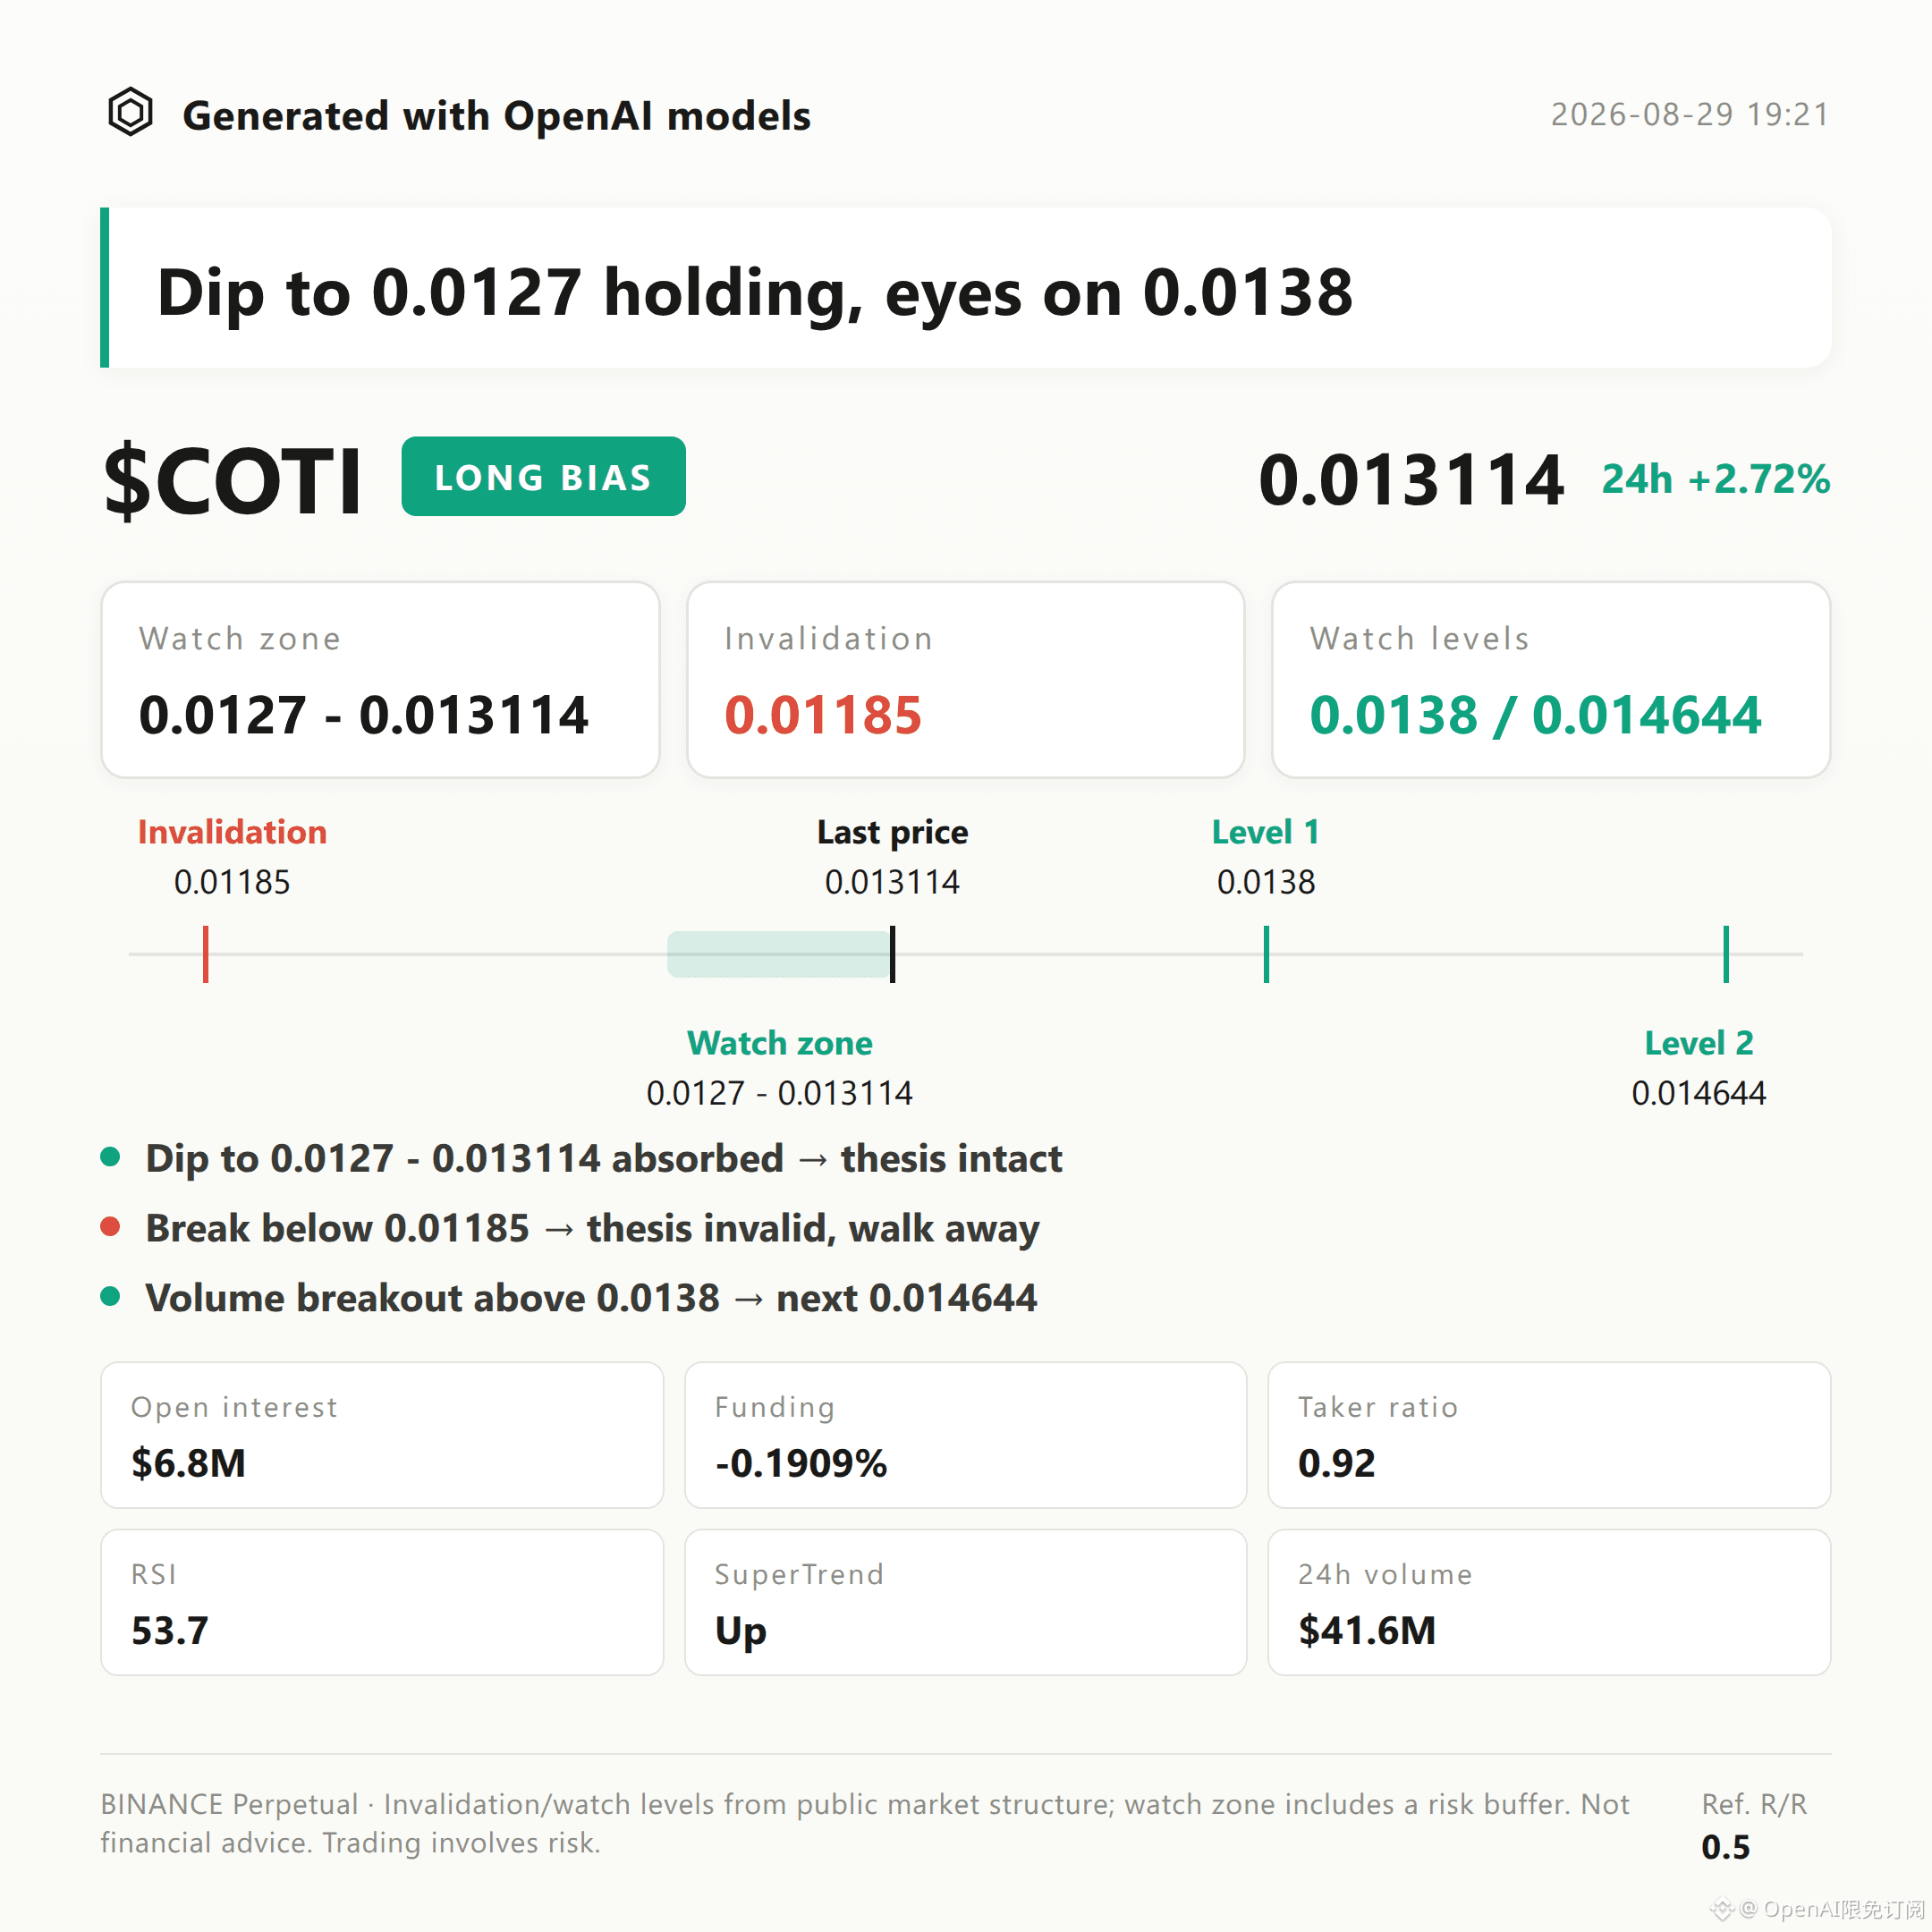
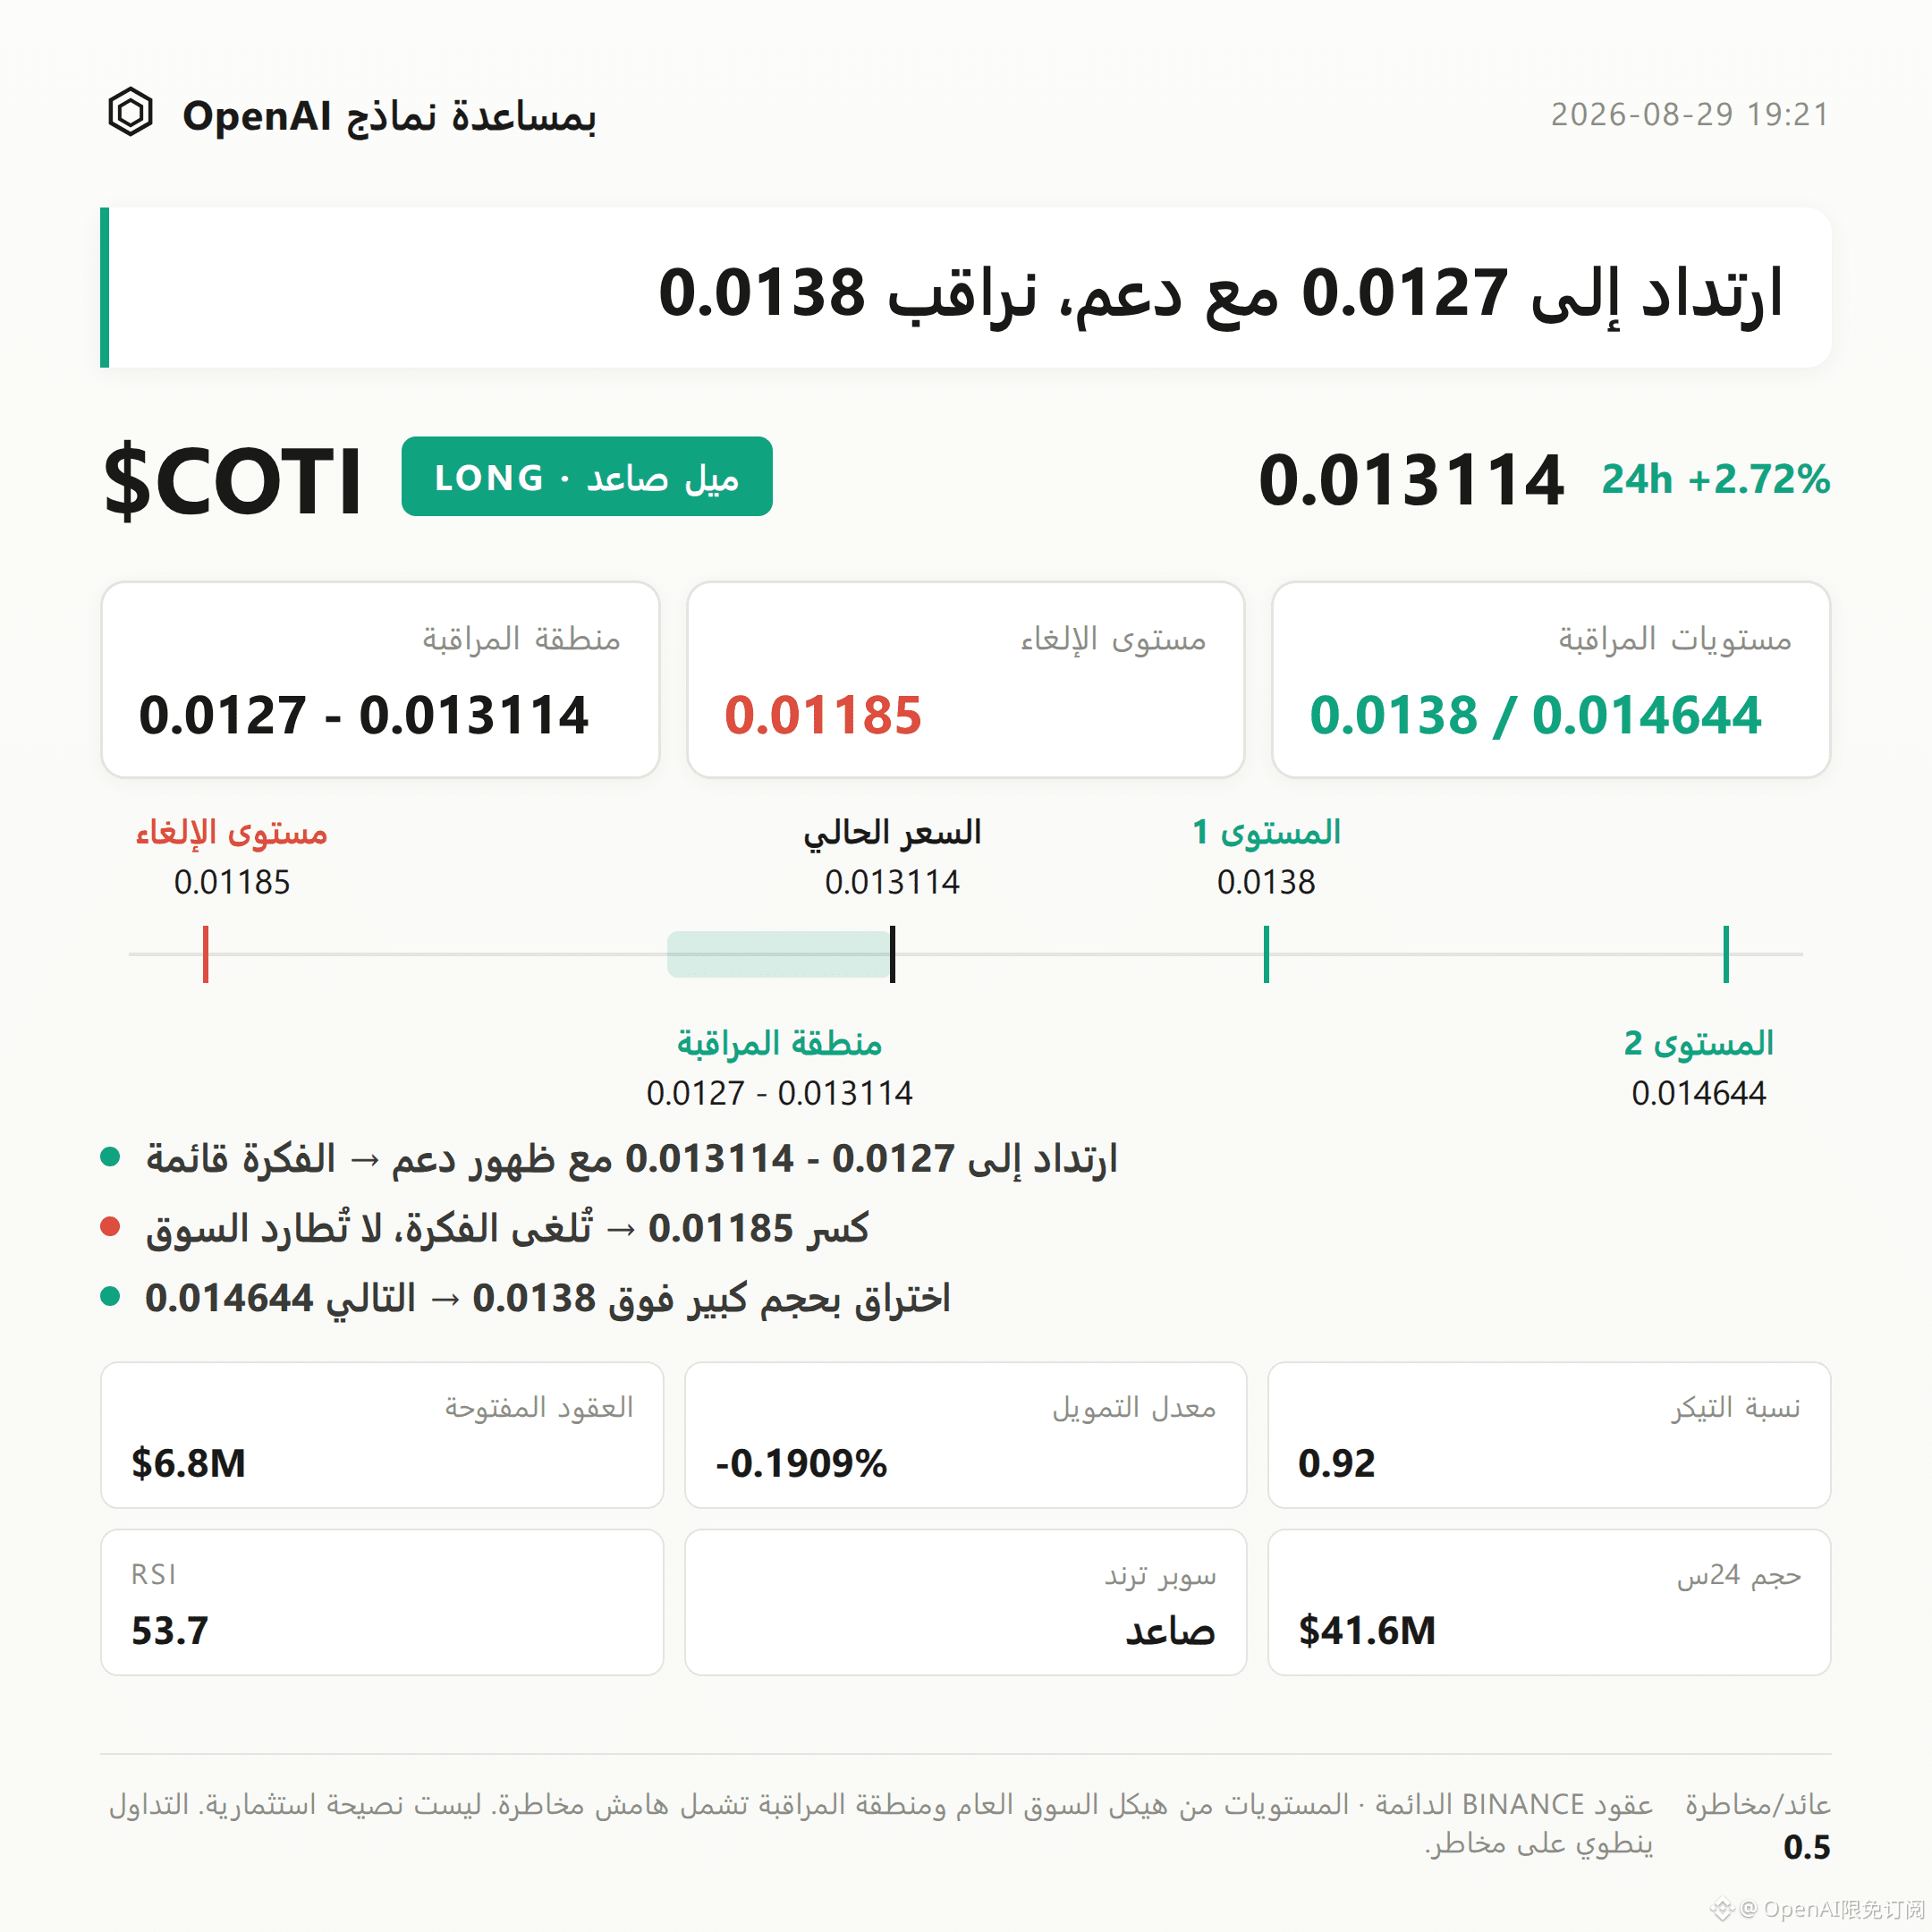
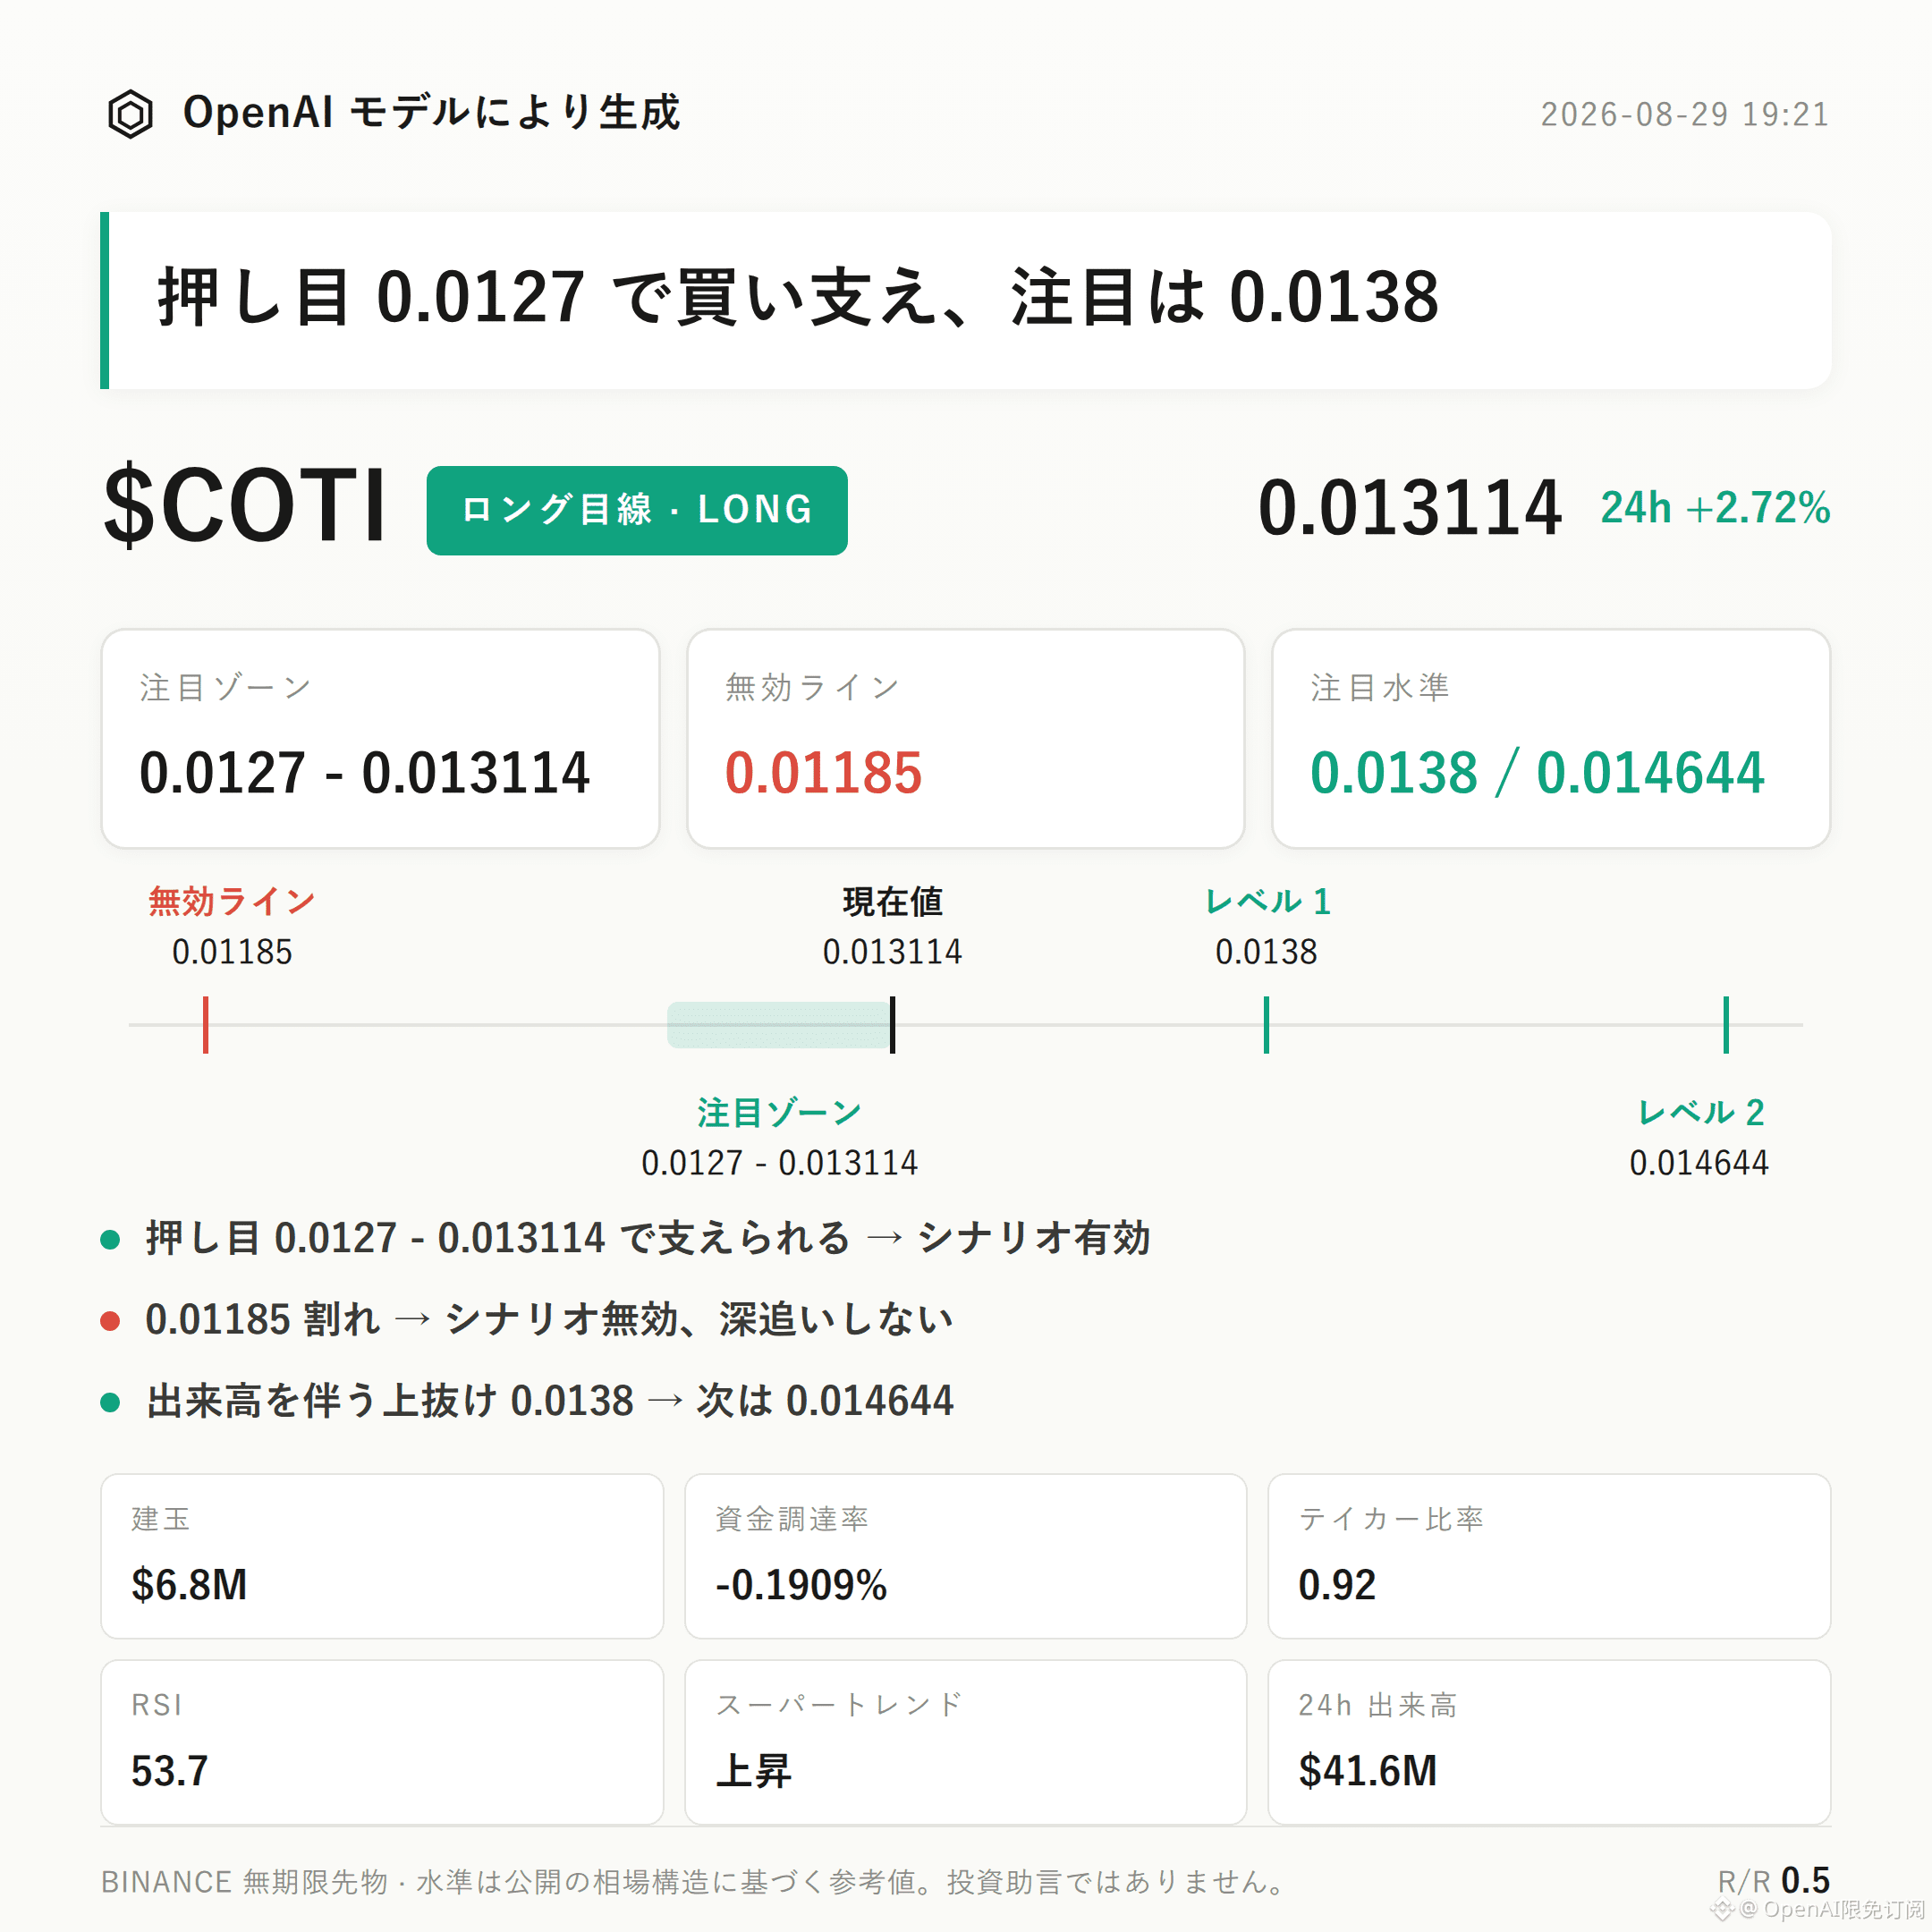
$COTI Bias: Bullish | Watch Zone 0.0127 - 0.013114 | Invalidation Reference 0.01185 | Observation Levels 0.0138 / 0.014644
$COTI The current structure is still biased bullish.
The core arguments come from the SuperTrend staying upward, MACD maintaining bullish momentum, and open interest increasing by 4.3% over the past 24 hours—contract funds are following the price higher rather than stepping aside and waiting.
The key is whether the bullish watch zone can continue to receive follow-through; this is the crucial validation point for whether this leg of structure can persist.
Structurally, the current price at 0.013114 sits between the recent low at 0.01185 and the recent high at 0.014644, positioned in the middle of a phase of repair.
The Bollinger Bands show the upper band at 0.0138, the middle band at 0.0127, and the lower band at 0.0116. Price is trading above the middle band and edging toward the upper band, indicating the price is still operating in a relatively strong channel area.
The SuperTrend indicator shows an upward move; MACD shows no weakening in bullish momentum. RSI is 53.7—within a neutral-to-bullish healthy range, not yet entering overbought.
Over the last 24 hours, trading value is about $41.57 million. Open interest is about $6.77 million and has increased by 4.3% in 24 hours, showing that contract funds are expanding in sync with the price rise rather than a simple pullback caused by position reductions.
The funding rate is -0.1909%. Currently, funding is being paid from shorts to longs, and the funding-rate structure diverges somewhat from the direction implied by the price rising—this is a variable that needs to be monitored continuously.
The long/short account ratio shows longs account for 42%, and the number distribution still favors shorts; the aggressive buy/sell ratio is 0.92, meaning sell orders slightly dominate and buys are not yet clearly stronger. This creates a notable contradiction with the upward price action, and it is the most important reverse signal in this cycle’s structure.
For the bullish watch zone, start by watching 0.0127 to 0.013114. It’s more suitable to wait for a pullback into this area and then look for follow-through before confirming the structure, rather than assuming the trend will continue based on the current price alone.
If there is follow-through in the watch zone, the bullish structure can be regarded as valid on a phase basis. If the price breaks below 0.01185, it means the current push-up structure has been damaged; the bullish thesis should be treated as invalid and should not be applied further.
Above, 0.0138 is an extension observation level. If there is a breakout with volume and it continues, then reassess the resistance behavior near the recent high around 0.014644. If volume is insufficient, this level is more likely to form only phase-based resistance.
Need to state this plainly: the current aggressive buy/sell ratio of 0.92 means aggressive sell orders are still slightly dominant and the buy side is not clearly stronger. This does not fully match the bullish signals such as SuperTrend, MACD, and the rise in open interest—direction has not yet formed a complete bullish consensus.
The long/short account ratio also indicates the number of short accounts is higher. Sentiment has not fully turned optimistic. The reference risk/reward ratio used in this article is 0.5, meaning the structure itself is not very loose; it must be handled strictly with the invalidation level in mind.
With contract leverage, position discipline is more important than direction judgment.
Live disclosure: This account currently holds $FOGO long contracts. Structurally, I continue to look for upside; my view is consistent with my positioning.
$COTI Bias: Bullish | Watch Zone 0.0127 - 0.013114 | Invalidation Reference 0.01185 | Observation Levels 0.0138 / 0.014644
$COTI The current structure is still biased bullish.
The core arguments come from the SuperTrend staying upward, MACD maintaining bullish momentum, and open interest increasing by 4.3% over the past 24 hours—contract funds are following the price higher rather than stepping aside and waiting.
The key is whether the bullish watch zone can continue to receive follow-through; this is the crucial validation point for whether this leg of structure can persist.
Structurally, the current price at 0.013114 sits between the recent low at 0.01185 and the recent high at 0.014644, positioned in the middle of a phase of repair.
The Bollinger Bands show the upper band at 0.0138, the middle band at 0.0127, and the lower band at 0.0116. Price is trading above the middle band and edging toward the upper band, indicating the price is still operating in a relatively strong channel area.
The SuperTrend indicator shows an upward move; MACD shows no weakening in bullish momentum. RSI is 53.7—within a neutral-to-bullish healthy range, not yet entering overbought.
Over the last 24 hours, trading value is about $41.57 million. Open interest is about $6.77 million and has increased by 4.3% in 24 hours, showing that contract funds are expanding in sync with the price rise rather than a simple pullback caused by position reductions.
The funding rate is -0.1909%. Currently, funding is being paid from shorts to longs, and the funding-rate structure diverges somewhat from the direction implied by the price rising—this is a variable that needs to be monitored continuously.
The long/short account ratio shows longs account for 42%, and the number distribution still favors shorts; the aggressive buy/sell ratio is 0.92, meaning sell orders slightly dominate and buys are not yet clearly stronger. This creates a notable contradiction with the upward price action, and it is the most important reverse signal in this cycle’s structure.
For the bullish watch zone, start by watching 0.0127 to 0.013114. It’s more suitable to wait for a pullback into this area and then look for follow-through before confirming the structure, rather than assuming the trend will continue based on the current price alone.
If there is follow-through in the watch zone, the bullish structure can be regarded as valid on a phase basis. If the price breaks below 0.01185, it means the current push-up structure has been damaged; the bullish thesis should be treated as invalid and should not be applied further.
Above, 0.0138 is an extension observation level. If there is a breakout with volume and it continues, then reassess the resistance behavior near the recent high around 0.014644. If volume is insufficient, this level is more likely to form only phase-based resistance.
Need to state this plainly: the current aggressive buy/sell ratio of 0.92 means aggressive sell orders are still slightly dominant and the buy side is not clearly stronger. This does not fully match the bullish signals such as SuperTrend, MACD, and the rise in open interest—direction has not yet formed a complete bullish consensus.
The long/short account ratio also indicates the number of short accounts is higher. Sentiment has not fully turned optimistic. The reference risk/reward ratio used in this article is 0.5, meaning the structure itself is not very loose; it must be handled strictly with the invalidation level in mind.
With contract leverage, position discipline is more important than direction judgment.
Live disclosure: This account currently holds $FOGO long contracts. Structurally, I continue to look for upside; my view is consistent with my positioning.