
“The price drops quickly, but confidence returns slowly.”
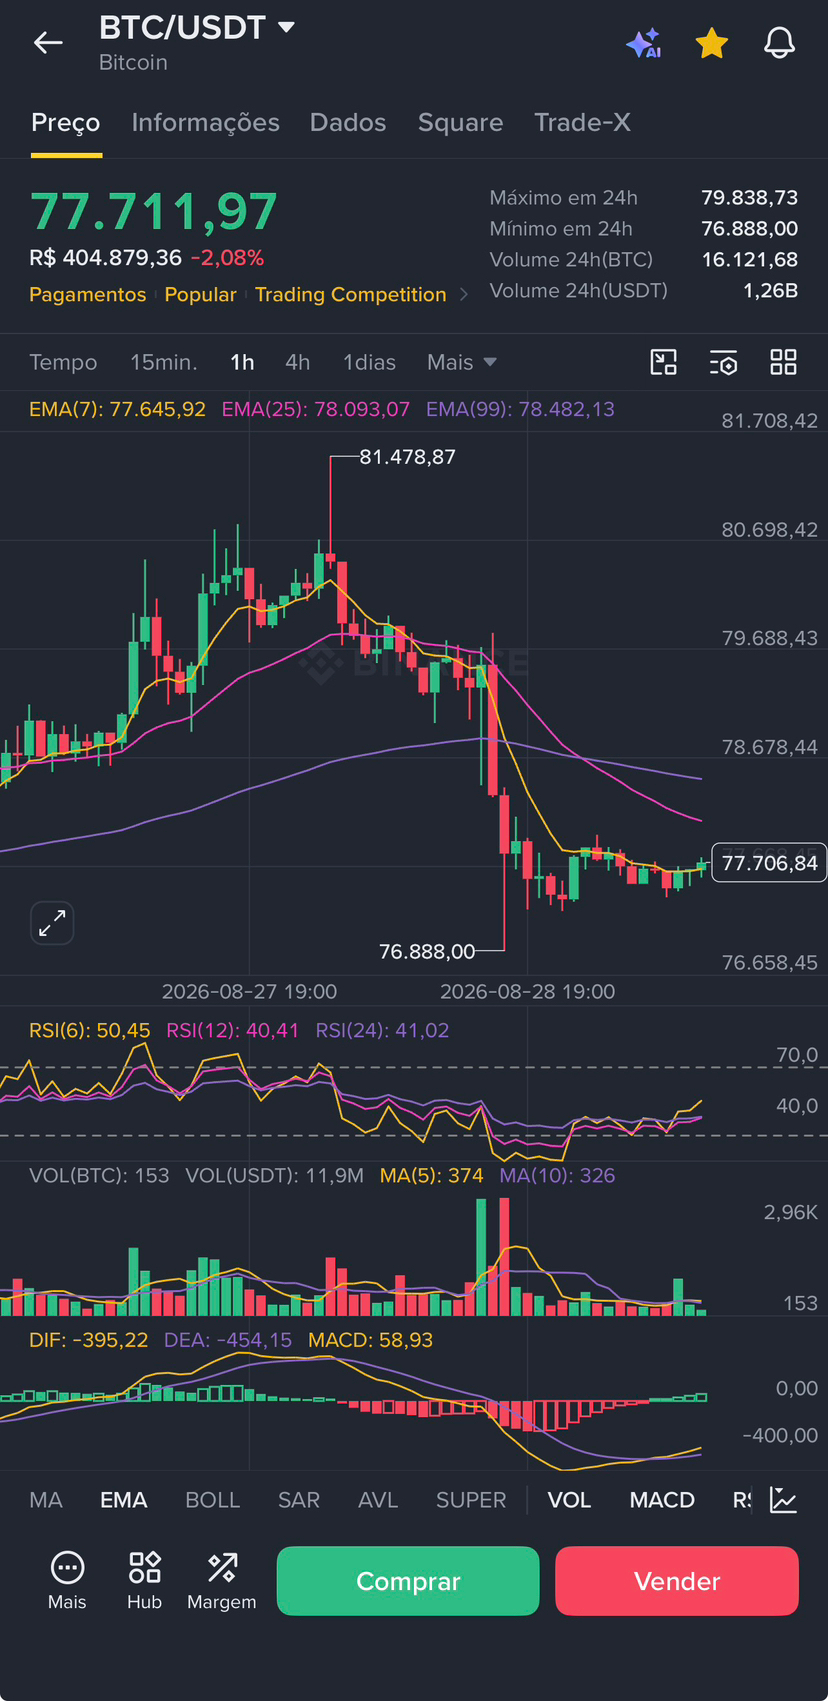
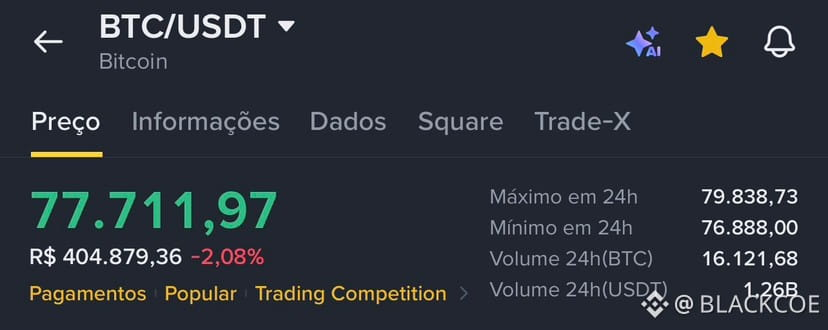
BTC/USDT is trading at US$ 77,687.99, accumulating a 2.10% drop. In the last 24 hours, it reached a high of US$ 79,838.73 and a low of US$ 76,888.00, moving 16,124.89 BTC, equivalent to US$ 1.26 billion.
📊 WHAT DOES THE 1-HOUR CHART SHOW?
Bitcoin tries to stabilize after strong selling pressure, but it still remains below the most important moving averages:
• EMA 7: US$ 77,641.21
• EMA 25: US$ 78,091.62
• EMA 99: US$ 78,481.76
The 7 EMA shows an immediate reaction, but the 25 and 99 EMAs form a barrier between US$ 78,091 and US$ 78,482. As long as the price stays below this range, any rise may still be just a pullback.
🔍 THE INDICATORS REVEAL AN ATTEMPT AT A REACTION
• RSI 6: 49.08
• RSI 12: 39.81
• RSI 24: 40.77
The short RSI recovered, but the larger periods remain below 50, indicating fragility.
On the MACD, the histogram advanced to +57.73, while DIF (-396.72) and DEA (-454.45) remain below zero. Selling pressure has lost intensity, but the reversal has not yet been confirmed.
🎯 DECISIVE MAP
🟢 Supports: US$ 77,000, US$ 76,888, and US$ 76,658
🔴 Resistances: US$ 78,092, US$ 78,482, and US$ 79,839–80,000
📈 Above US$ 78,482, BTC may once again target US$ 80 thousand.
📉 Losing US$ 76,888 increases the risk of the downtrend continuing.
The market does not reward those trying to guess the bottom. It rewards those who wait for confirmation, control risk, and protect capital.
👇 For you, will BTC break above US$ 80k or lose US$ 76,888 first?