2.7 US dollars’ TRUMP—are you brave enough to chase it?
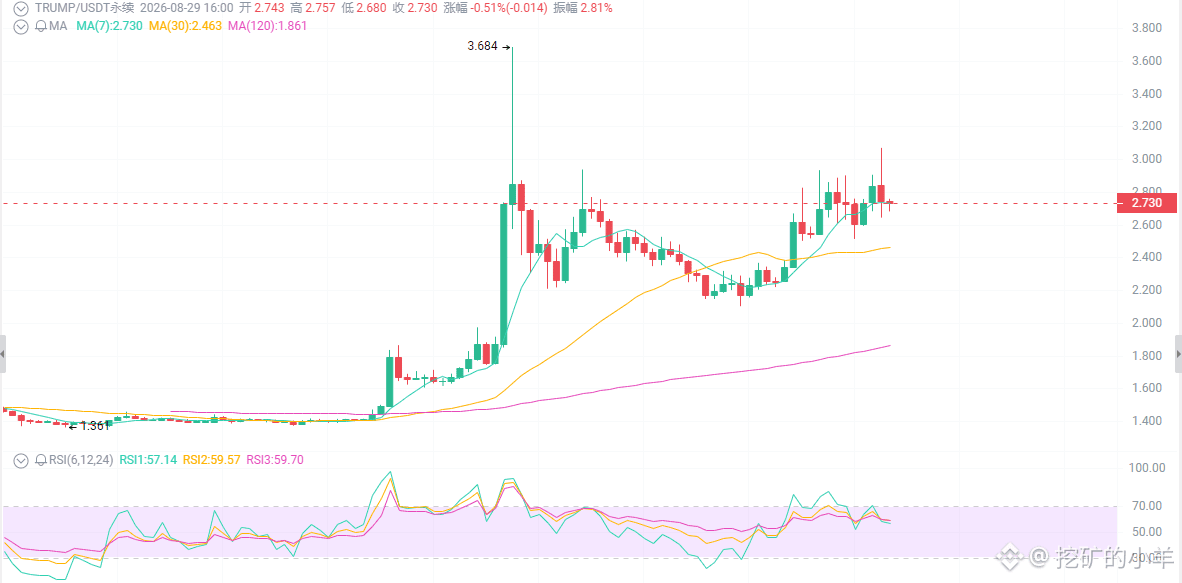
First, the surface picture: it bounced from 1.37 to 3.07, doubling.
In mid-August it formed a bottom at 1.37–1.50. On 8/22 it briefly spiked to 3.64; although it pulled back, the weekly chart is up 48% and the monthly chart up 88%. It broke through the 2.05 bear-market suppression on increased volume, and it’s now above the EMA20/50. The weekly chart has printed higher highs and higher lows—so the mid-term trend has reversed. But RSI is at 73 (overbought), the upper Bollinger Band has been pierced, and the team is selling coins.
First: the team is selling coins, but the market doesn’t seem to care
In the past 48 hours, the project wallet swapped TRUMP for 3.38 million USDC, sent 646,000 tokens to OKX, and transferred another 2.62 million tokens (about $6.2 million). The market interprets this as “insiders cashing out.”
However, unlocks aren’t finished yet—on September 18 there are another 28.7 million tokens still to be distributed to insiders, with roughly 900,000 tokens linearly released every day.
Retail traders are shouting “MAGA to the moon,” while the team is calmly dumping.
Second: the supply structure is terrible—this is TRUMP’s ceiling
Total supply is 1 billion, but circulating supply is only 200–250 million (20–25%). The creator/CIC Digital-related pools account for a very high proportion, and unlocks continue until the end of 2027.
If you buy 1 TRUMP now, behind it there are 4 other batches waiting to unlock and sell pressure the market.
900,000 new coins enter the market each day—equivalent to daily selling pressure of more than $2 million.
On September 18, the 28.7 million-token batch, valued at current prices, is about 4% of market cap released all at once.
Third: technicals show conflicting signals
Bull case:
Breaking out above 2.05 bear-market suppression on increased volume, with higher highs and higher lows on the weekly chart
Trading above EMA20/50 (about 1.8–2.0), and the 20-week EMA around 2.21 becomes new support
ADX around 43, trend strength isn’t weak
Bear case:
RSI 73 is overbought; StochRSI/CCI are generally overheated
Today it pierced the Bollinger upper band at 2.80–2.93 and then fell back—long upper wick
The 200-day moving average around 2.36–2.71 is right in the middle of a tug-of-war zone
The 3.07 intraday high has hit a wall once already
Trading strategy
For short-term traders:
If it rebounds to 2.88–3.05 and 15m/1h shows bearish divergence, reduce longs or lightly short. Targets: 2.70–2.55. Stop-loss: 3.12. Around 2.7, consider take-profit and buy back lower.
For swing traders:
Wait for a pullback to 2.52–2.58 on declining volume with selling stopping, or a clearer support confirmation at 2.28–2.35, then go long. Targets: 2.90–3.10–3.60. Stop-loss: below the structure low at 2.18, or below 2.03.
When can you switch to attacking?
Only when the daily chart reclaims 3.11, volume follows through, and the retest holds without breaking 2.80—then you can set targets at 3.67/4.4+.
First, the surface picture: it bounced from 1.37 to 3.07, doubling.
In mid-August it formed a bottom at 1.37–1.50. On 8/22 it briefly spiked to 3.64; although it pulled back, the weekly chart is up 48% and the monthly chart up 88%. It broke through the 2.05 bear-market suppression on increased volume, and it’s now above the EMA20/50. The weekly chart has printed higher highs and higher lows—so the mid-term trend has reversed. But RSI is at 73 (overbought), the upper Bollinger Band has been pierced, and the team is selling coins.
First: the team is selling coins, but the market doesn’t seem to care
In the past 48 hours, the project wallet swapped TRUMP for 3.38 million USDC, sent 646,000 tokens to OKX, and transferred another 2.62 million tokens (about $6.2 million). The market interprets this as “insiders cashing out.”
However, unlocks aren’t finished yet—on September 18 there are another 28.7 million tokens still to be distributed to insiders, with roughly 900,000 tokens linearly released every day.
Retail traders are shouting “MAGA to the moon,” while the team is calmly dumping.
Second: the supply structure is terrible—this is TRUMP’s ceiling
Total supply is 1 billion, but circulating supply is only 200–250 million (20–25%). The creator/CIC Digital-related pools account for a very high proportion, and unlocks continue until the end of 2027.
If you buy 1 TRUMP now, behind it there are 4 other batches waiting to unlock and sell pressure the market.
900,000 new coins enter the market each day—equivalent to daily selling pressure of more than $2 million.
On September 18, the 28.7 million-token batch, valued at current prices, is about 4% of market cap released all at once.
Third: technicals show conflicting signals
Bull case:
Breaking out above 2.05 bear-market suppression on increased volume, with higher highs and higher lows on the weekly chart
Trading above EMA20/50 (about 1.8–2.0), and the 20-week EMA around 2.21 becomes new support
ADX around 43, trend strength isn’t weak
Bear case:
RSI 73 is overbought; StochRSI/CCI are generally overheated
Today it pierced the Bollinger upper band at 2.80–2.93 and then fell back—long upper wick
The 200-day moving average around 2.36–2.71 is right in the middle of a tug-of-war zone
The 3.07 intraday high has hit a wall once already
Trading strategy
For short-term traders:
If it rebounds to 2.88–3.05 and 15m/1h shows bearish divergence, reduce longs or lightly short. Targets: 2.70–2.55. Stop-loss: 3.12. Around 2.7, consider take-profit and buy back lower.
For swing traders:
Wait for a pullback to 2.52–2.58 on declining volume with selling stopping, or a clearer support confirmation at 2.28–2.35, then go long. Targets: 2.90–3.10–3.60. Stop-loss: below the structure low at 2.18, or below 2.03.
When can you switch to attacking?
Only when the daily chart reclaims 3.11, volume follows through, and the retest holds without breaking 2.80—then you can set targets at 3.67/4.4+.