Trading Thesis|8/29 14:21
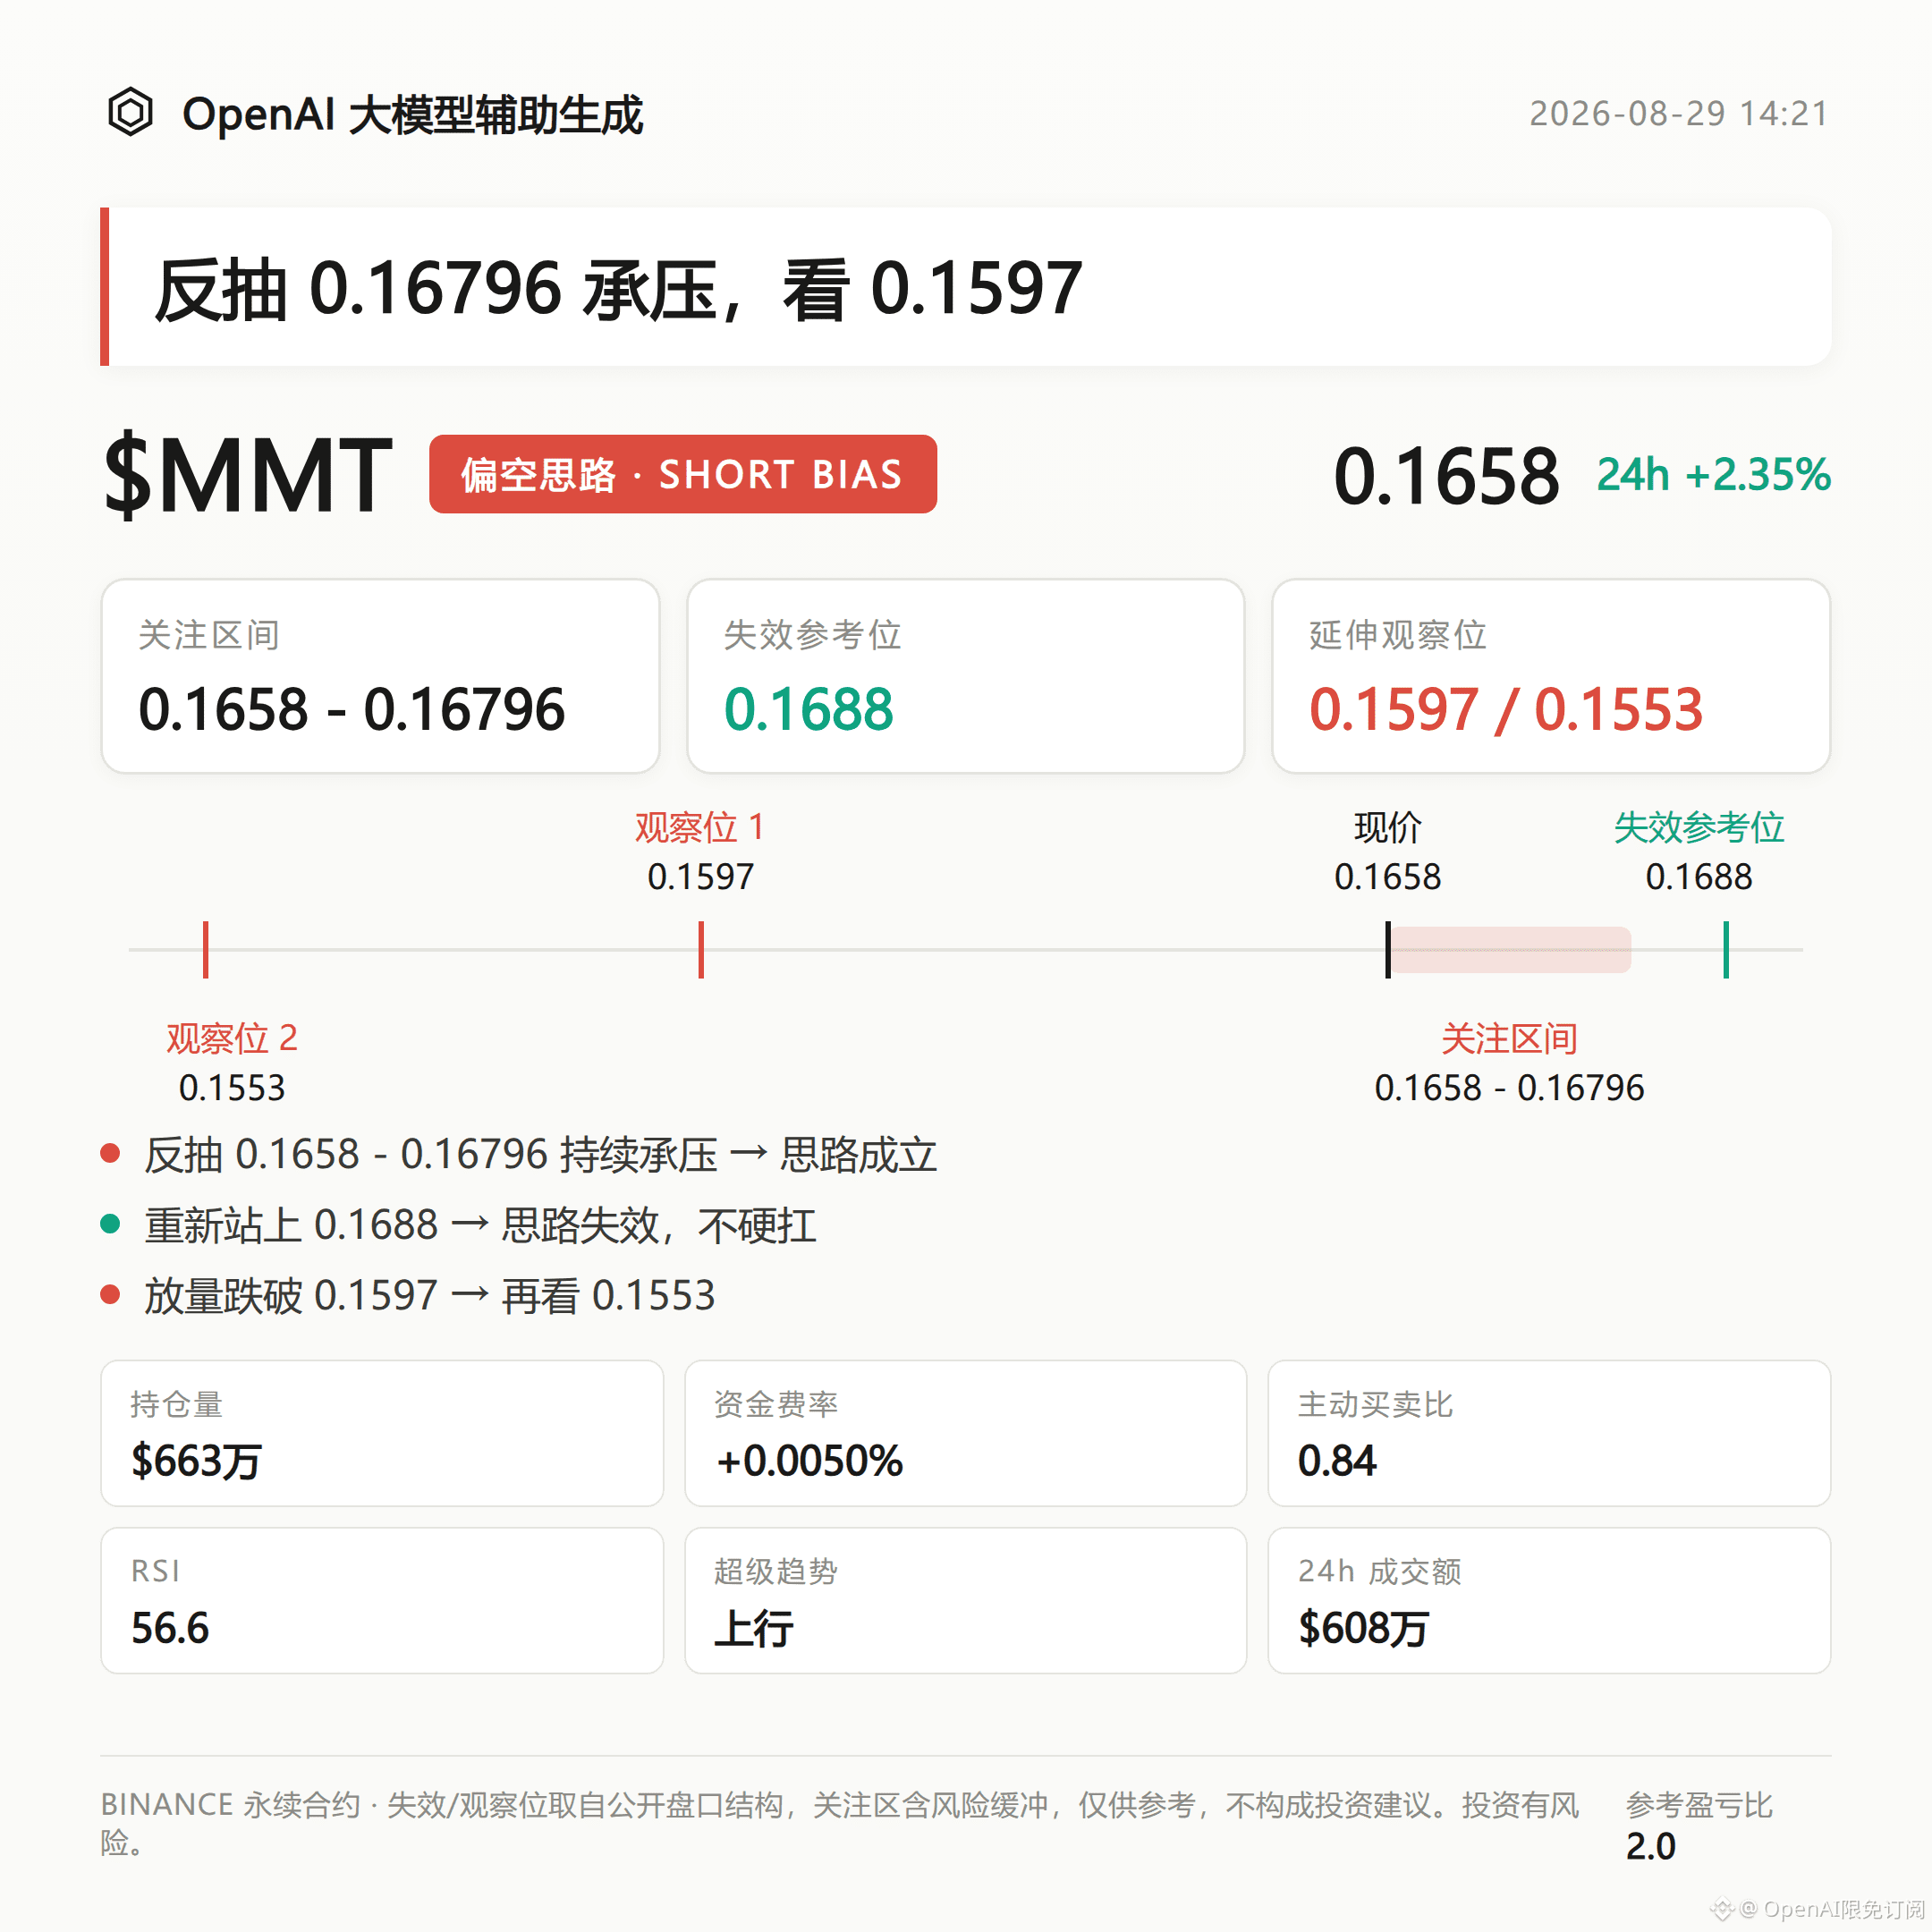
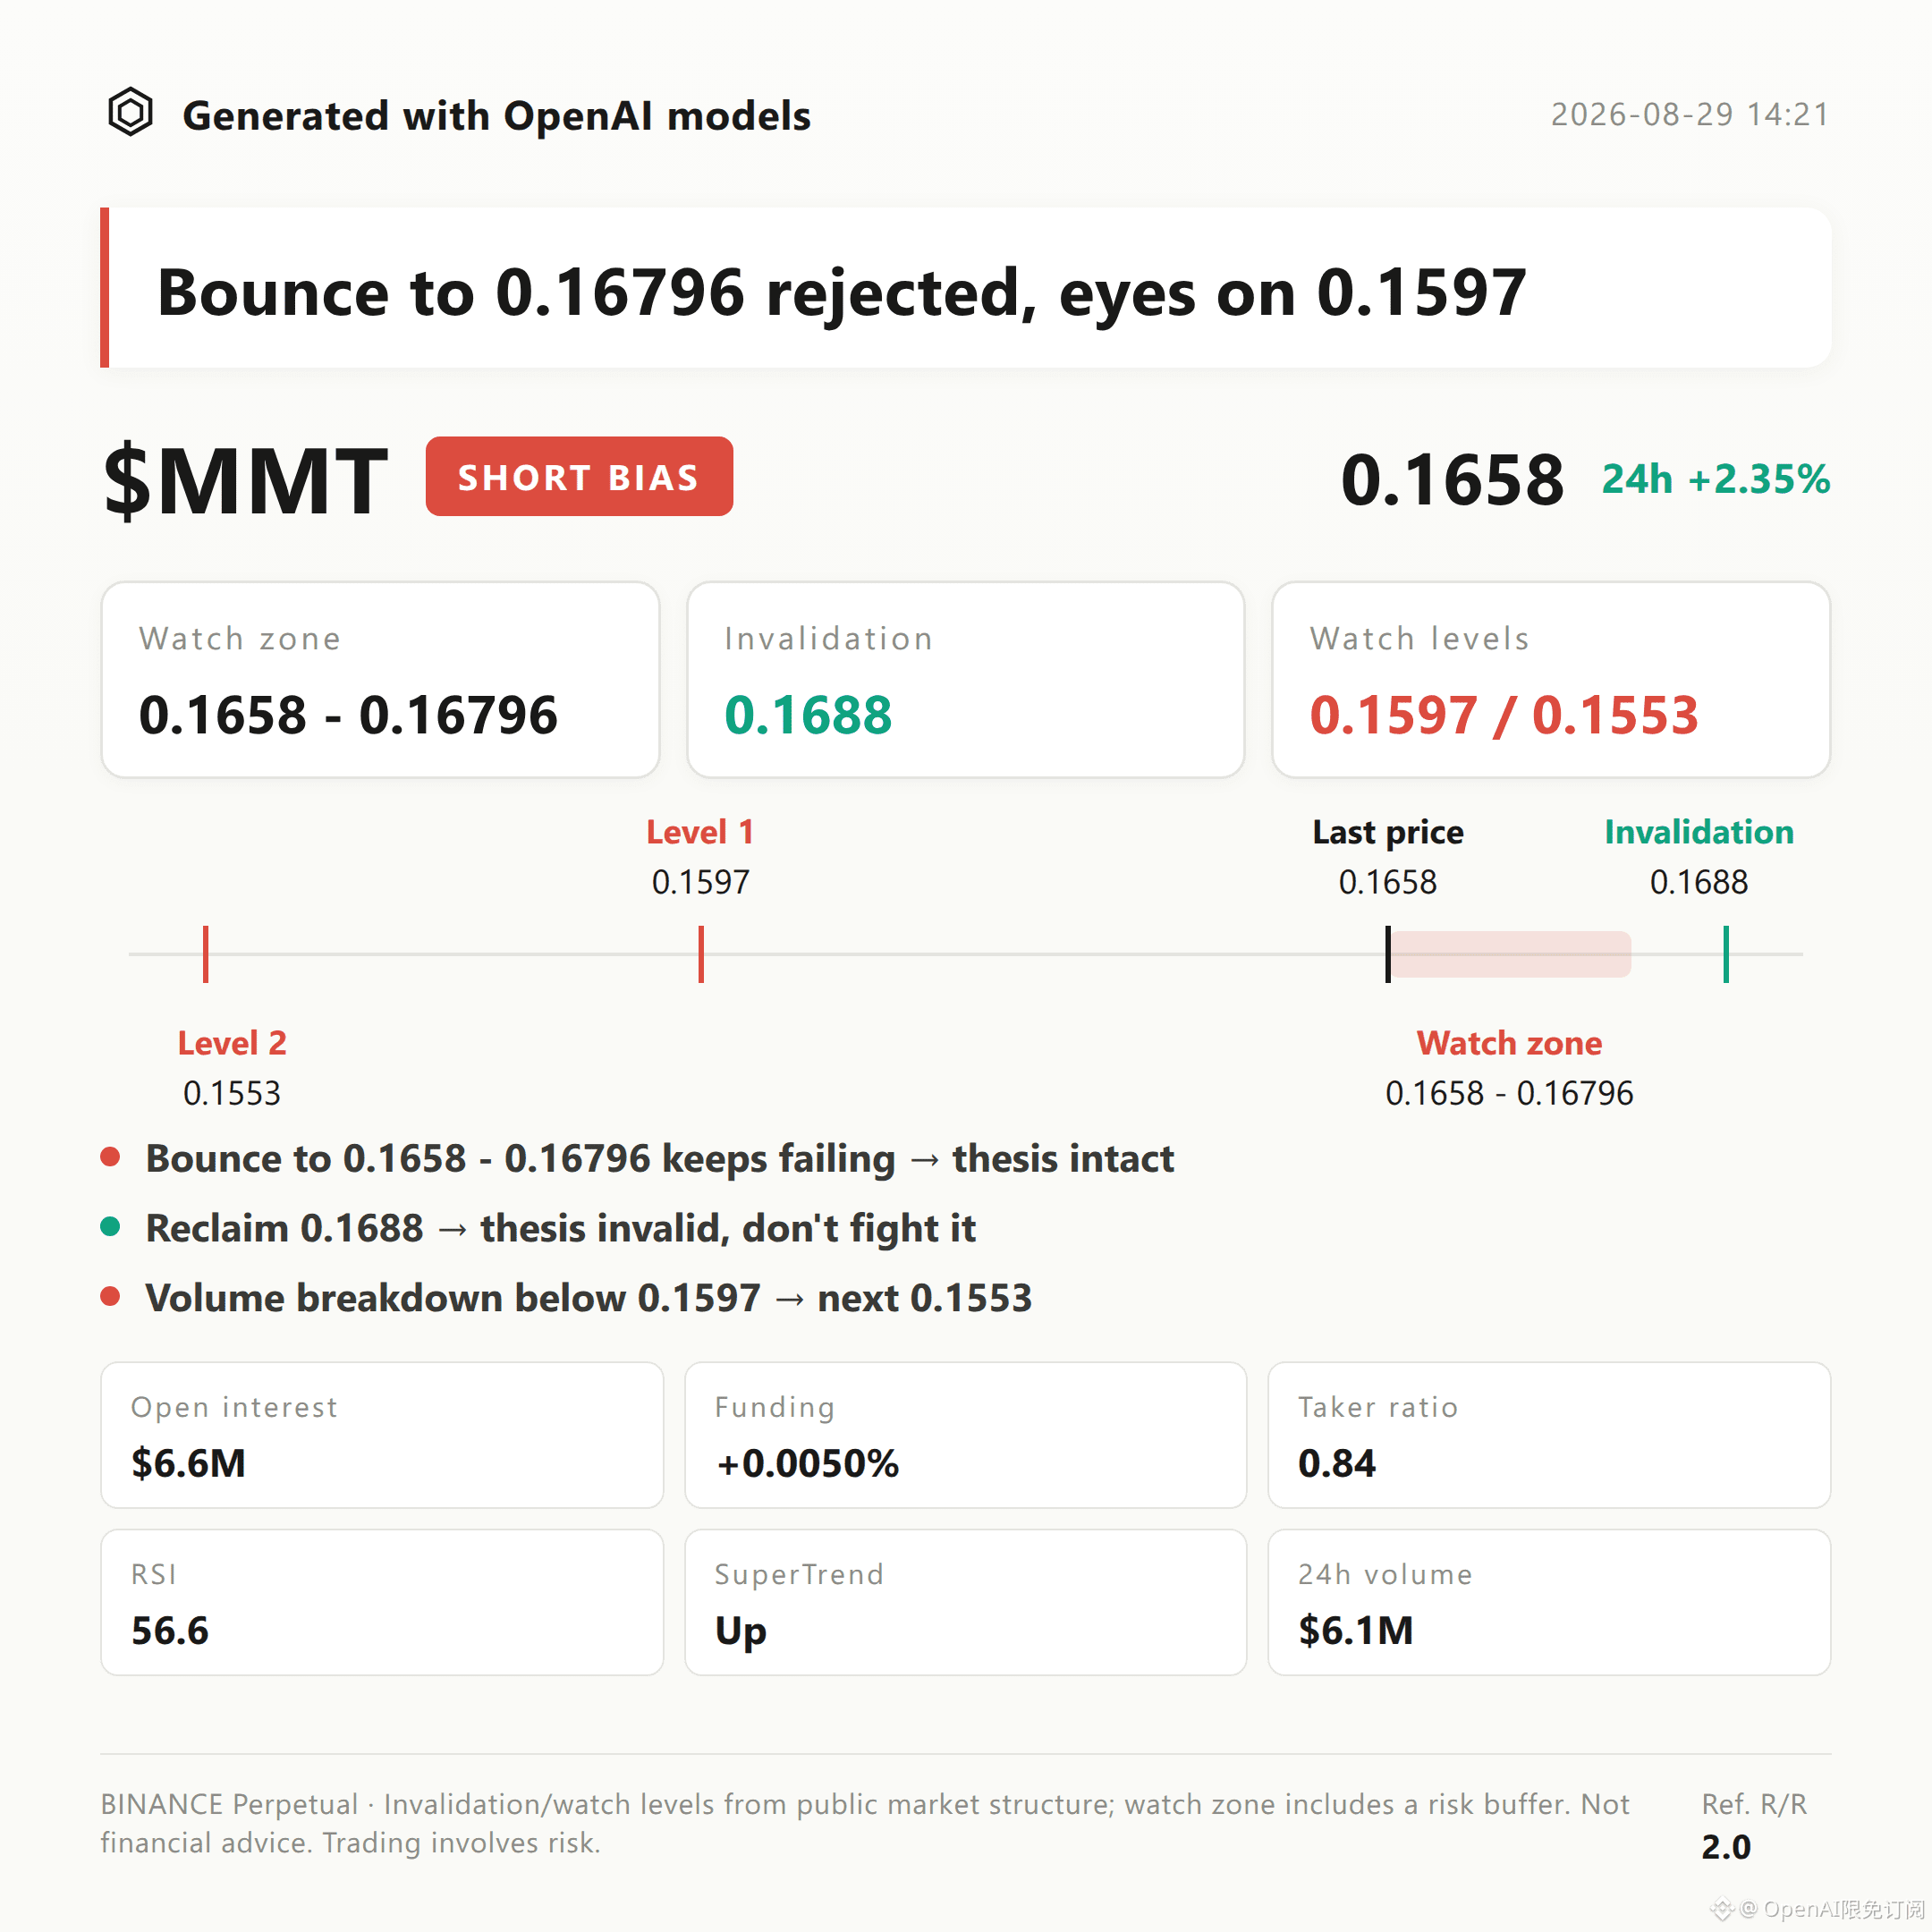
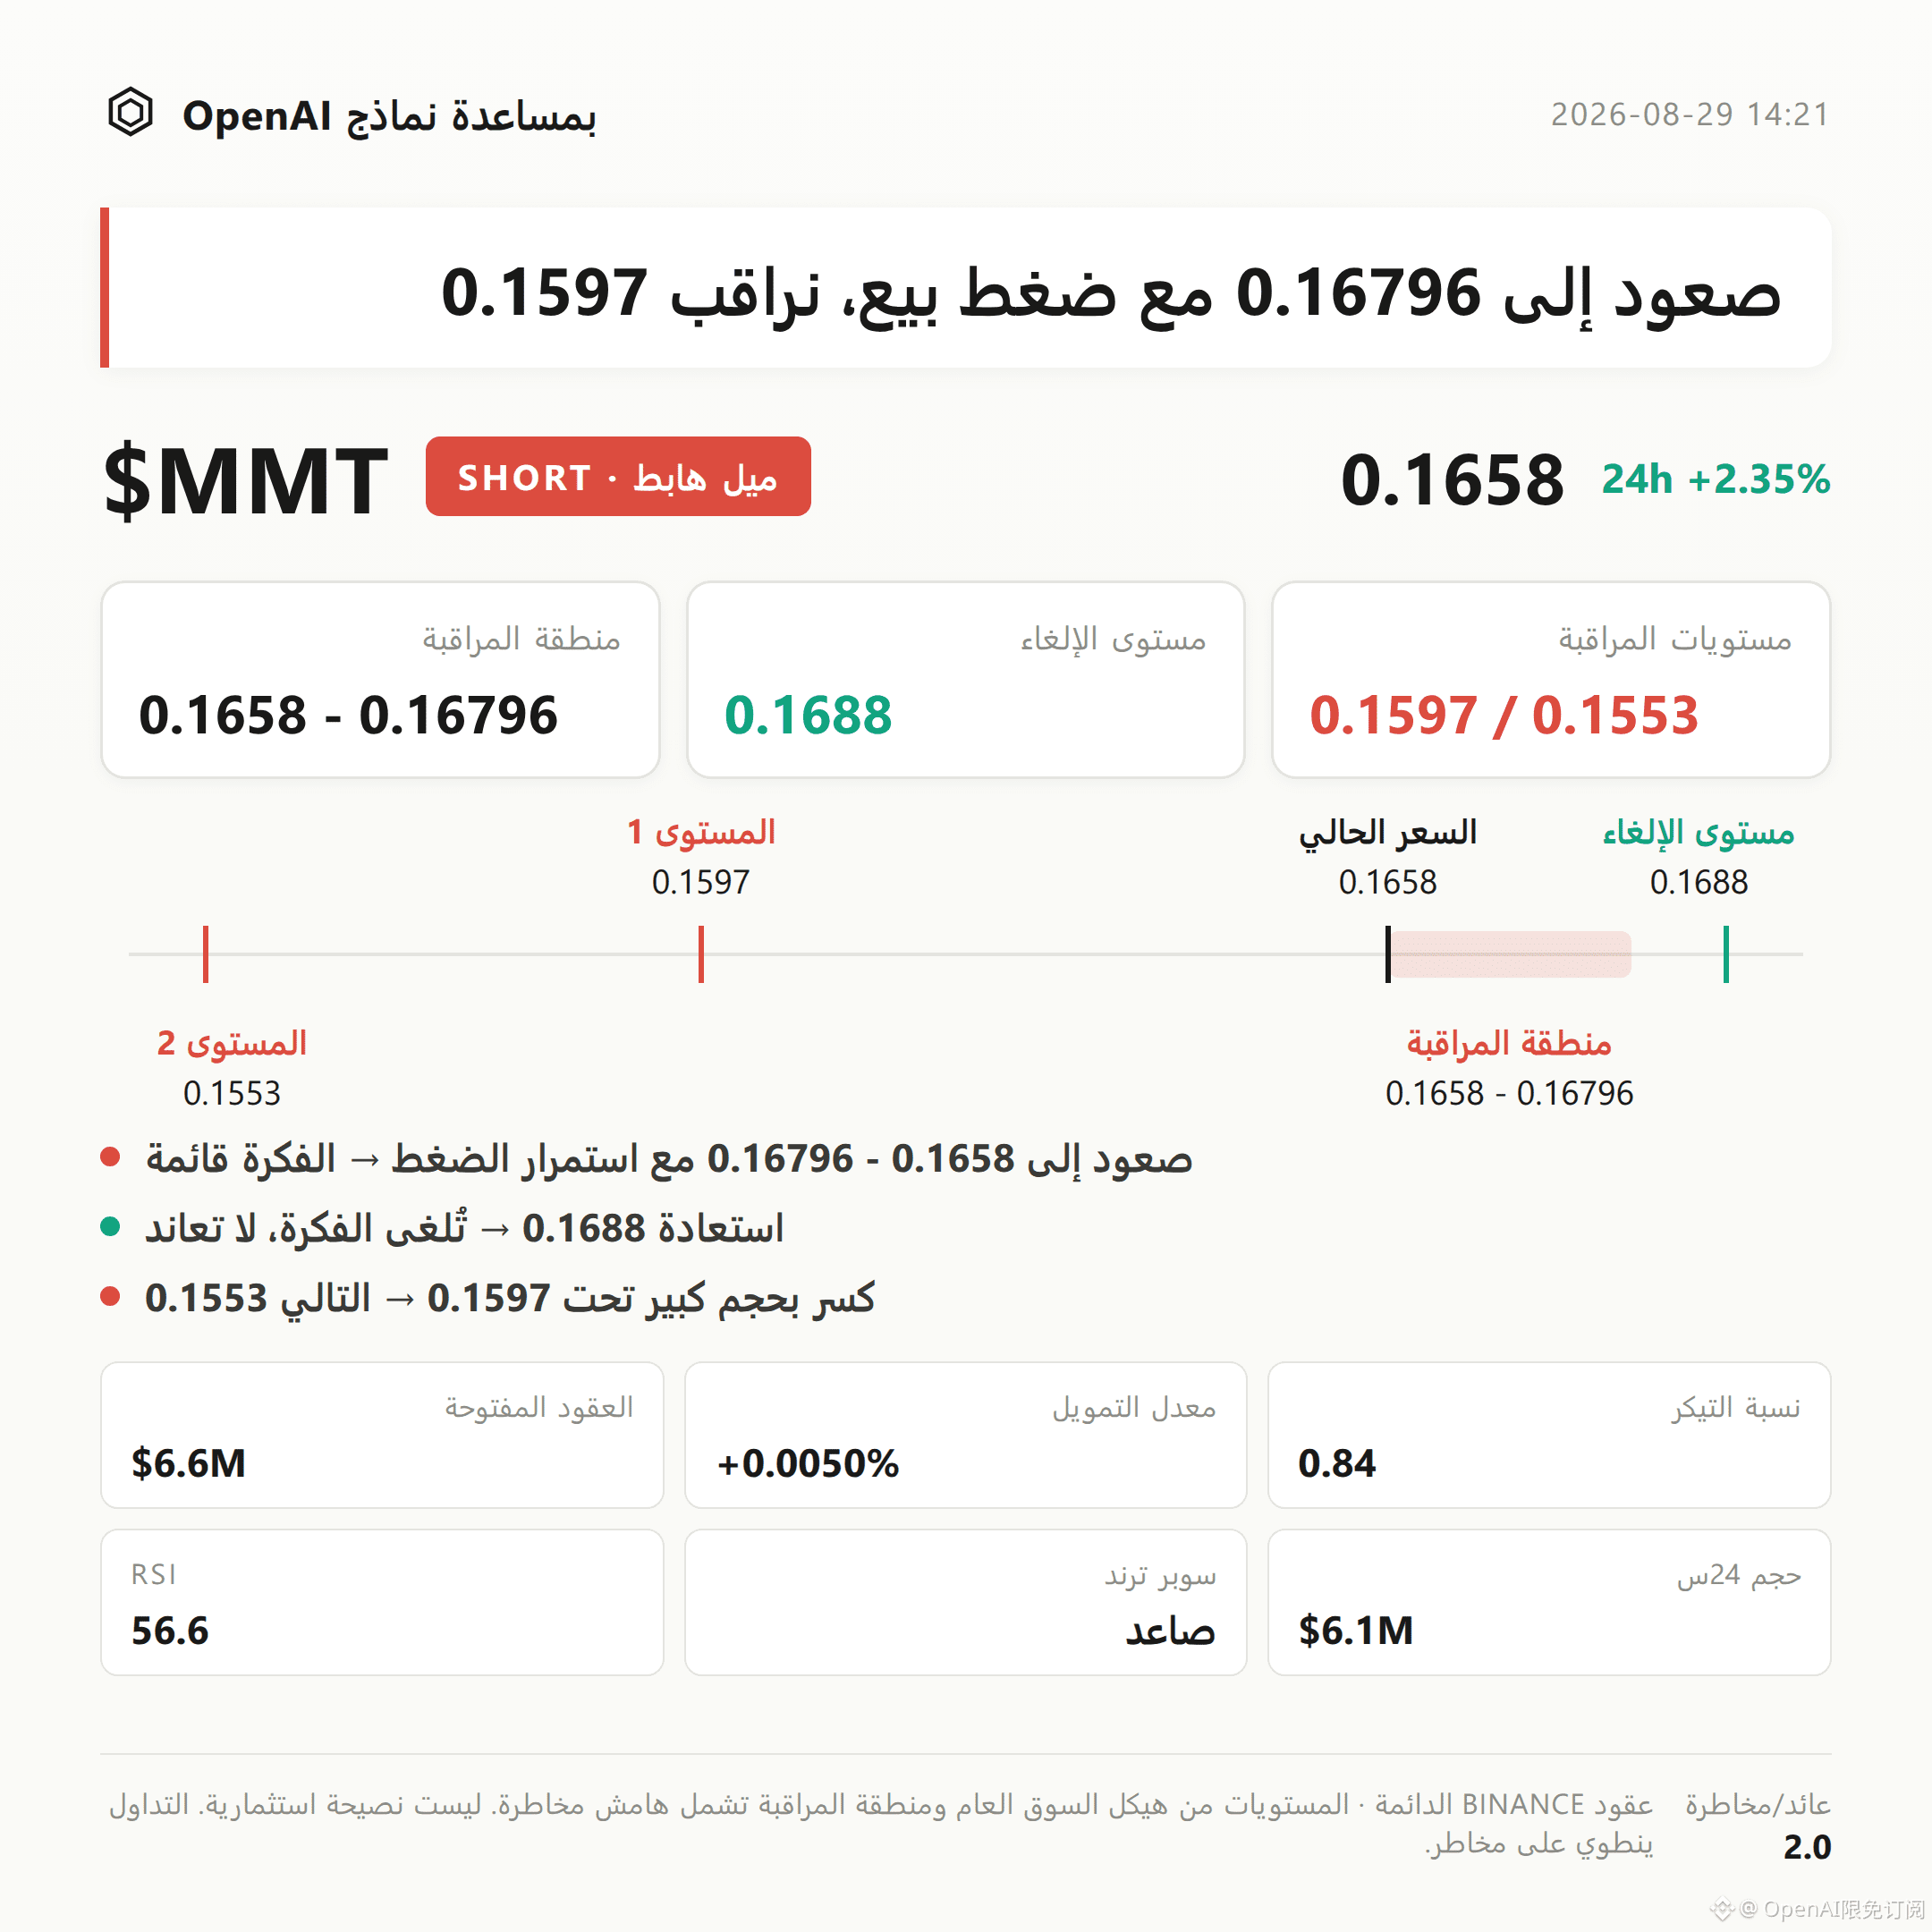
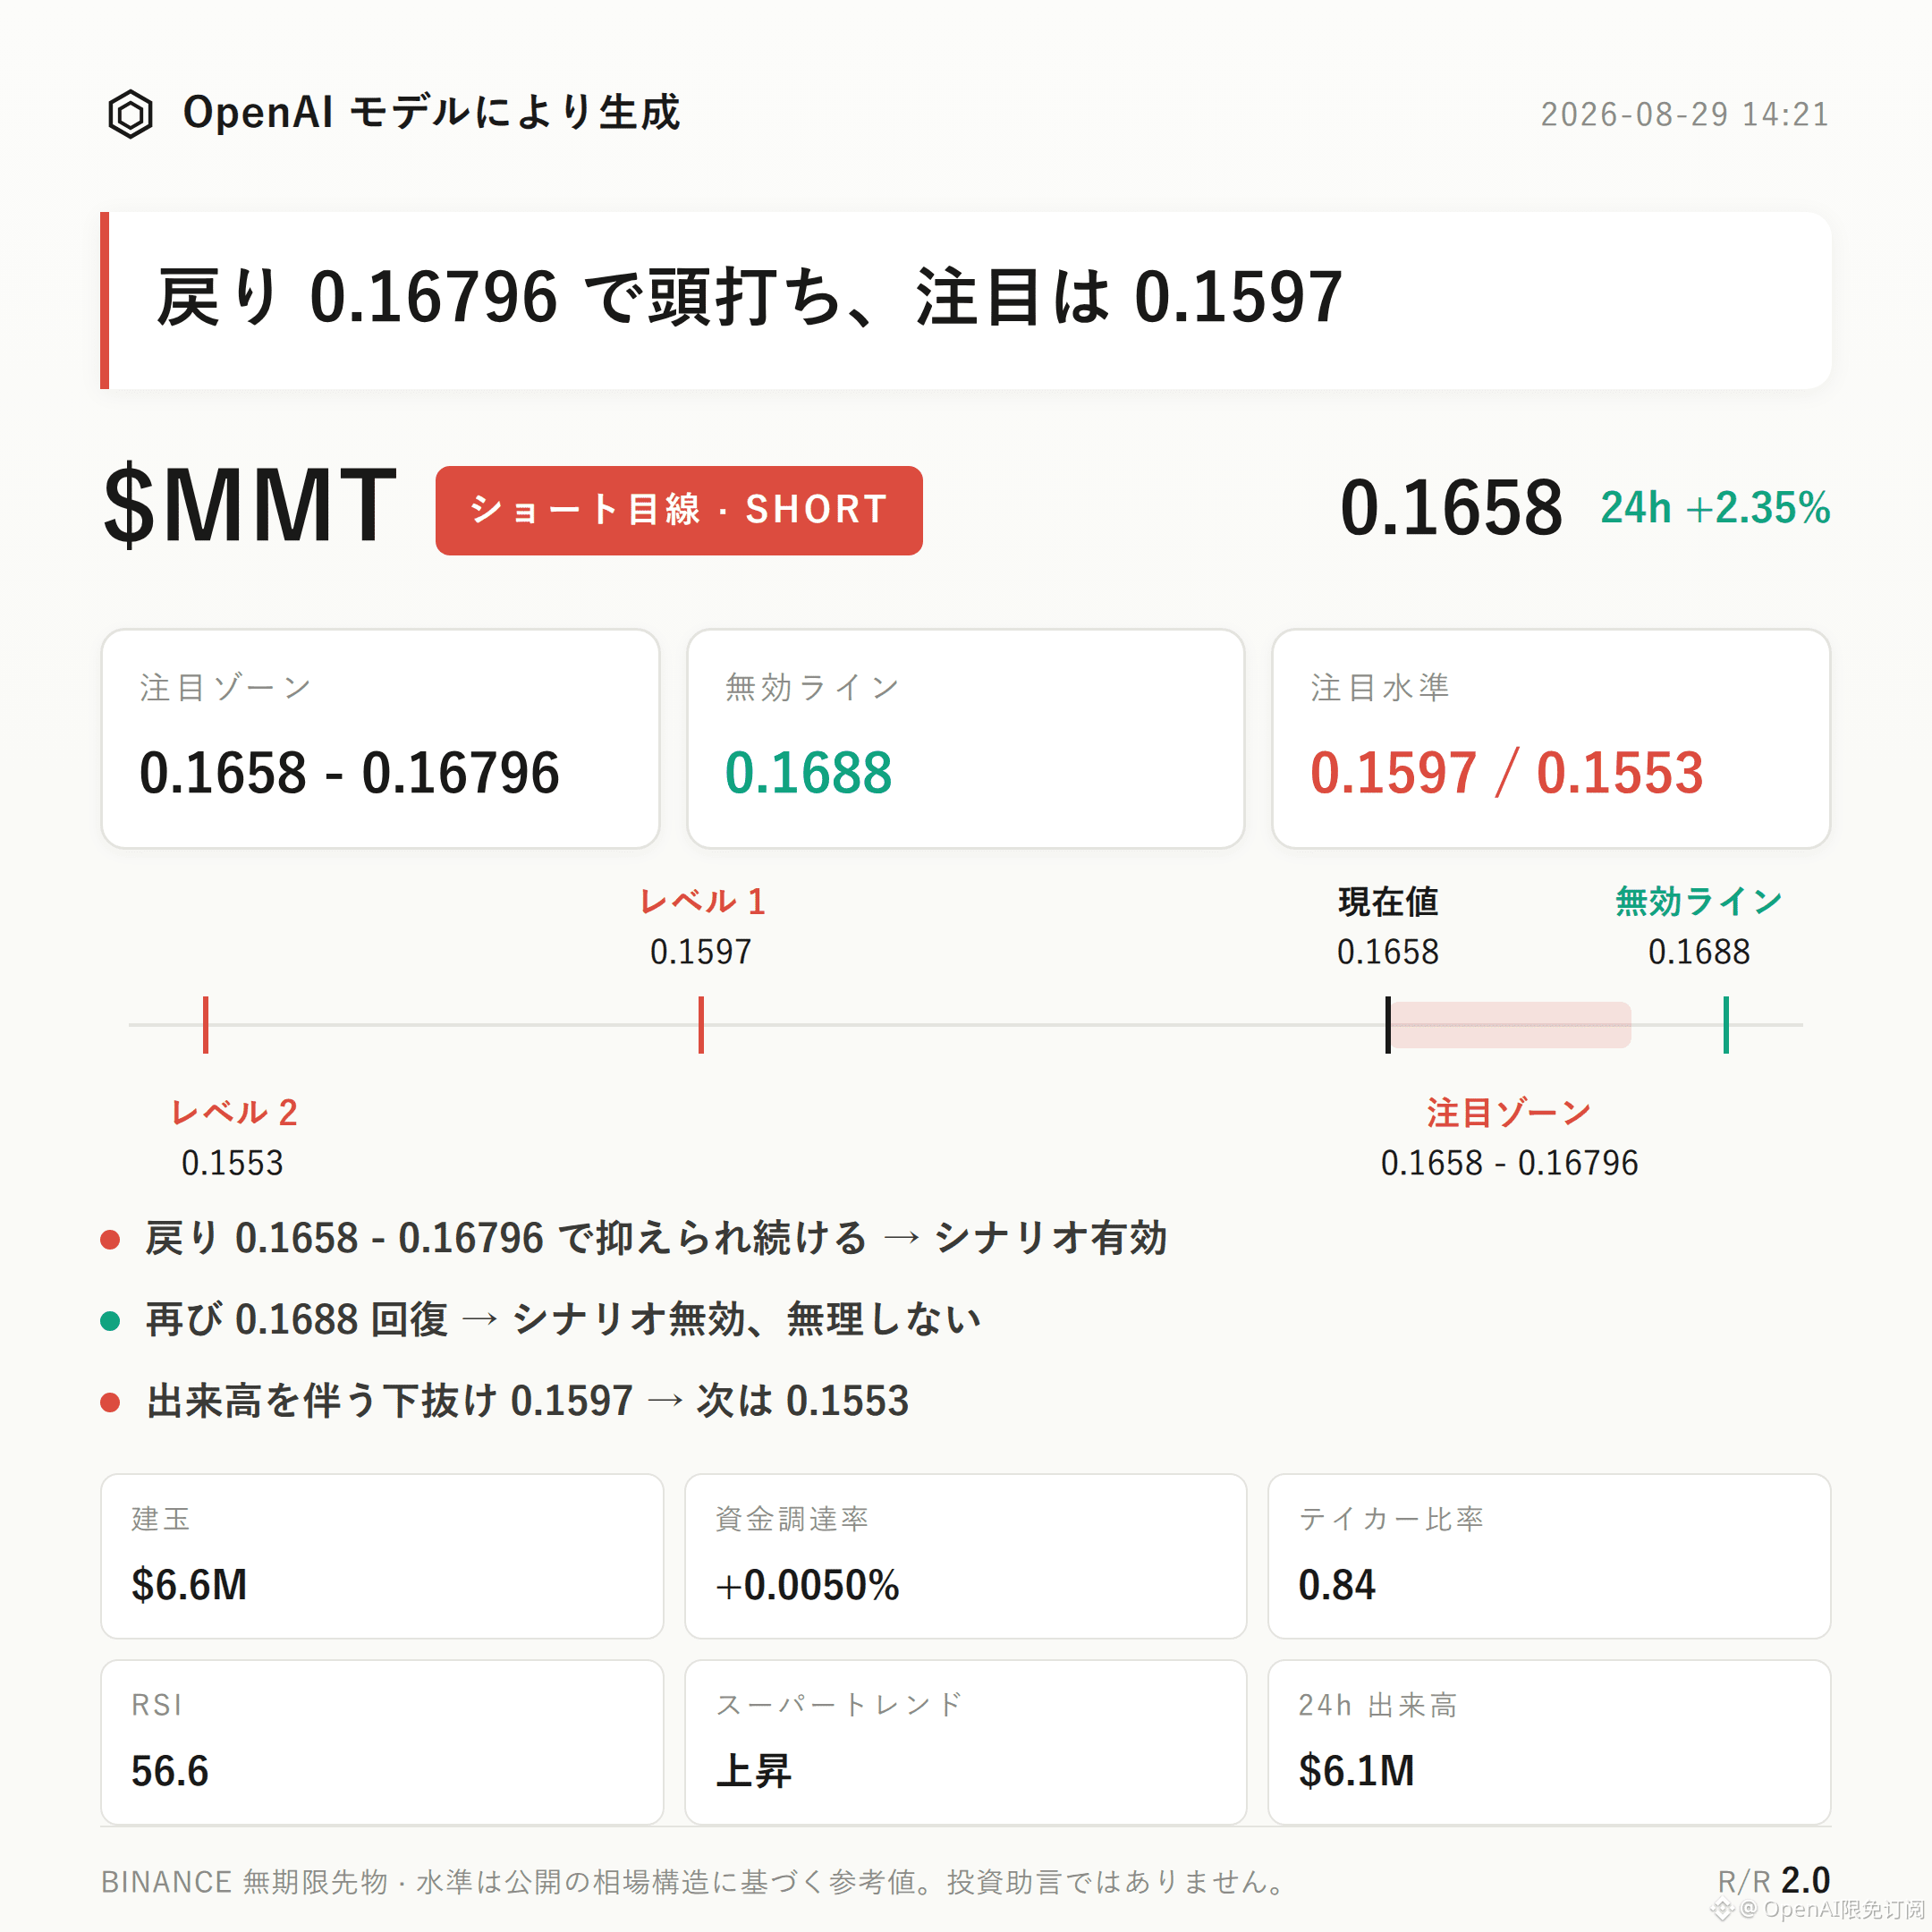
$MMT Bearish Bias | Focus Zone 0.1658 - 0.16796 | Invalidation Reference 0.1688 | Observation Levels 0.1597 / 0.1553
$MMT The current bearish structure is unfolding.
Key point: The ratio of aggressive buy/sell is 0.84, with sell orders taking the upper hand; the current price 0.1658 is nearing the upper Bollinger Band at 0.1681 and coincides with the recent high of 0.1688, creating a resistance confluence; the 24-hour open interest decreased by 1.6%, suggesting contract capital has not entered in sync with the price.
The validation method is to see whether a pullback into the focus zone of 0.1658-0.16796 can be suppressed, rather than automatically assuming pressure the moment the price touches it.
Technically, the recent high at 0.1688 aligns with the Bollinger upper band at 0.1681, forming a short-term resistance confluence zone, and the current price 0.1658 is trading below that region.
There is room for a downside pullback between the Bollinger middle band at 0.1639 and the lower band at 0.1597.
It’s important to state the facts: the Super Trend indicator is still pointing upward, the MACD maintains bullish momentum, and RSI is 56.6—has not entered the overbought range. This looks more like temporary pressure within an upswing rhythm, not a trend-level reversal signal.
Regarding derivatives data: the 24-hour trading amount is about $6.08 million, open interest about $6.63 million, and the 24-hour change is -1.6%.
The funding rate is +0.0050%, which is low; the cost basis for longs is not high.
The aggressive buy/sell ratio is 0.84, indicating aggressive sell orders are slightly dominant, and some short-term selling pressure is present.
For reference levels, for the short side the focus zone to watch first is 0.1658-0.16796. It’s more suitable to wait for confirmation after observing pullback pressure in that area, rather than making a short decision immediately upon first touch.
If, after a pullback into the focus zone, you see stall/lag or a drop, it can be considered a signal that the bearish thesis is temporarily valid.
If the price rises back above 0.1688, it means the current pullback structure has been broken and the bearish thesis is invalidated; the original judgment should not be continued.
For the downside extension observation level, watch 0.1597. If that level breaks with increased volume, then further observe support around 0.1553. The reference risk-reward ratio is around 2.0.
Be sure to disclose the reverse risk honestly: the long-vs-short account ratio data shows longs account for only 39%. The short positioning structure itself is already somewhat crowded. If a rebound occurs later, there’s no guarantee that this won’t trigger short-covering and create a temporary squeeze.
At the same time, Super Trend is still rising, MACD bullish momentum remains, and RSI has not entered overbought—these are all evidence contrary to the bearish thesis presented here, and they must be included in the overall judgment rather than selectively ignored.
With contract leverage, position discipline is more important than directional judgment.
Also, from the live position: $FOGO is still holding a long position. Personally, I remain bullish on the medium-term structure.
For reference only and does not constitute investment advice. Contracts have leverage and investing involves risk.
This article was generated with assistance from an OpenAI large model.
$MMT
#Contract Analysis
$MMT Bearish Bias | Focus Zone 0.1658 - 0.16796 | Invalidation Reference 0.1688 | Observation Levels 0.1597 / 0.1553
$MMT The current bearish structure is unfolding.
Key point: The ratio of aggressive buy/sell is 0.84, with sell orders taking the upper hand; the current price 0.1658 is nearing the upper Bollinger Band at 0.1681 and coincides with the recent high of 0.1688, creating a resistance confluence; the 24-hour open interest decreased by 1.6%, suggesting contract capital has not entered in sync with the price.
The validation method is to see whether a pullback into the focus zone of 0.1658-0.16796 can be suppressed, rather than automatically assuming pressure the moment the price touches it.
Technically, the recent high at 0.1688 aligns with the Bollinger upper band at 0.1681, forming a short-term resistance confluence zone, and the current price 0.1658 is trading below that region.
There is room for a downside pullback between the Bollinger middle band at 0.1639 and the lower band at 0.1597.
It’s important to state the facts: the Super Trend indicator is still pointing upward, the MACD maintains bullish momentum, and RSI is 56.6—has not entered the overbought range. This looks more like temporary pressure within an upswing rhythm, not a trend-level reversal signal.
Regarding derivatives data: the 24-hour trading amount is about $6.08 million, open interest about $6.63 million, and the 24-hour change is -1.6%.
The funding rate is +0.0050%, which is low; the cost basis for longs is not high.
The aggressive buy/sell ratio is 0.84, indicating aggressive sell orders are slightly dominant, and some short-term selling pressure is present.
For reference levels, for the short side the focus zone to watch first is 0.1658-0.16796. It’s more suitable to wait for confirmation after observing pullback pressure in that area, rather than making a short decision immediately upon first touch.
If, after a pullback into the focus zone, you see stall/lag or a drop, it can be considered a signal that the bearish thesis is temporarily valid.
If the price rises back above 0.1688, it means the current pullback structure has been broken and the bearish thesis is invalidated; the original judgment should not be continued.
For the downside extension observation level, watch 0.1597. If that level breaks with increased volume, then further observe support around 0.1553. The reference risk-reward ratio is around 2.0.
Be sure to disclose the reverse risk honestly: the long-vs-short account ratio data shows longs account for only 39%. The short positioning structure itself is already somewhat crowded. If a rebound occurs later, there’s no guarantee that this won’t trigger short-covering and create a temporary squeeze.
At the same time, Super Trend is still rising, MACD bullish momentum remains, and RSI has not entered overbought—these are all evidence contrary to the bearish thesis presented here, and they must be included in the overall judgment rather than selectively ignored.
With contract leverage, position discipline is more important than directional judgment.
Also, from the live position: $FOGO is still holding a long position. Personally, I remain bullish on the medium-term structure.
For reference only and does not constitute investment advice. Contracts have leverage and investing involves risk.
This article was generated with assistance from an OpenAI large model.
$MMT
#Contract Analysis