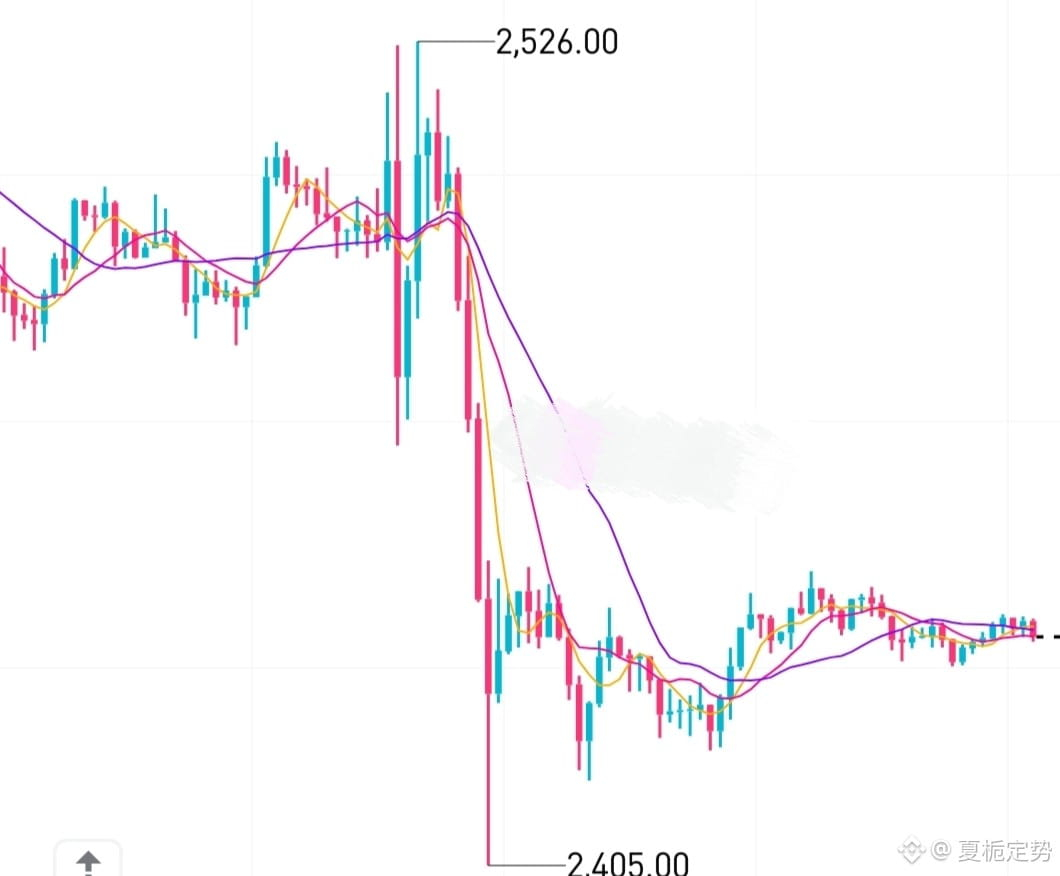
8.29 Biscuit Pattern Analysis
From the 1-hour timeframe, the market saw heavy volume selloff after the 2526.01 phase high, with the low dropping to 2403.7. After the big drop, price moved into a low-level, small rebound for repair. Currently, this is only a brief pause during the ongoing decline; the hourly bearish structure has not changed. After the short-term rebound meets resistance, there is still the possibility of further downside.
Trading idea: Short in the 2460–2480 range
Stop loss: 2495
First target: 2430
Second target: 2408#美联储9月加息概率升至57% #提词员付17万美元和解内幕交易案 #美国短期国债收益率上涨 #波场主网激活TVM布拉格大阪兼容 #沃什称通胀是美联储首要关注
From the 1-hour timeframe, the market saw heavy volume selloff after the 2526.01 phase high, with the low dropping to 2403.7. After the big drop, price moved into a low-level, small rebound for repair. Currently, this is only a brief pause during the ongoing decline; the hourly bearish structure has not changed. After the short-term rebound meets resistance, there is still the possibility of further downside.
Trading idea: Short in the 2460–2480 range
Stop loss: 2495
First target: 2430
Second target: 2408#美联储9月加息概率升至57% #提词员付17万美元和解内幕交易案 #美国短期国债收益率上涨 #波场主网激活TVM布拉格大阪兼容 #沃什称通胀是美联储首要关注