📉 BNB CONSOLIDATES AFTER CORRECTION: THE MARKET SEEKS BALANCE! ⚡
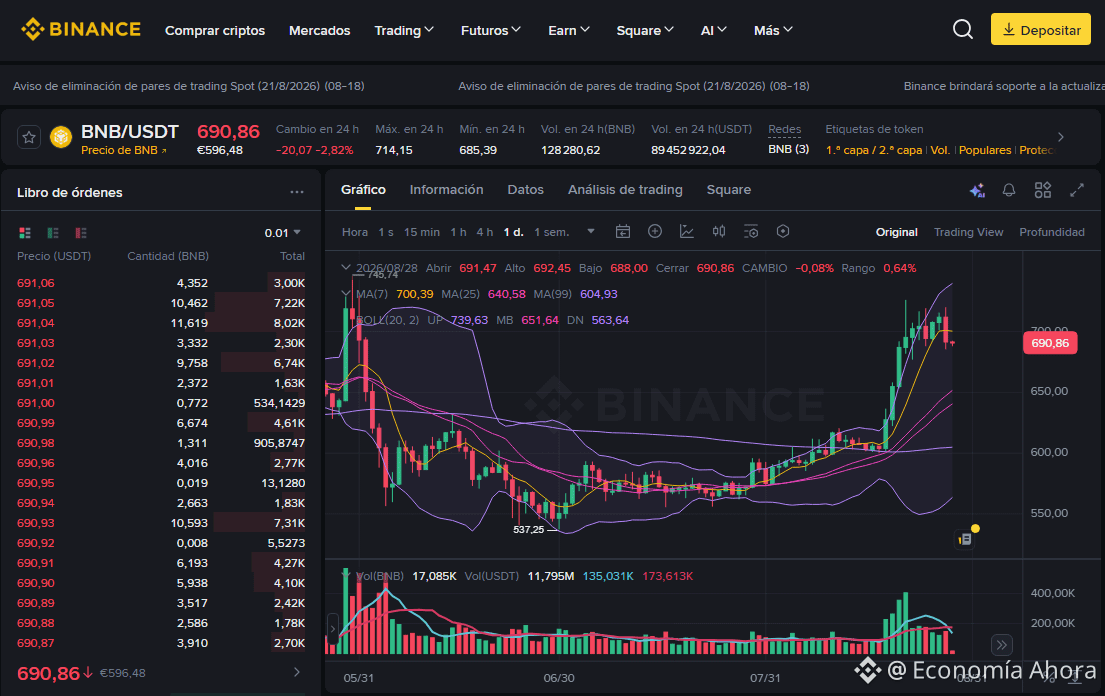
The daily chart of BNB/USDT shows a phase of correction and technical consolidation, trading at 690.86, which represents a -2.82% adjustment over the last 24 hours. Its daily trading range recorded a high of 714.15 and a low of 685.39, reflecting a logical cooldown after testing resistance levels close to the upper zone.
🔍 Trend Analysis and Indicators
Trend: Bullish short-term consolidation. The price is trading near the fast moving average MA(7) (700.39), maintaining solid structural room above MA(25) (640.58) and MA(99) (604.93).
Bollinger Bands: Price is pulling back from the upper zone and is trying to stabilize below the upper band in UP: 739.63, indicating moderation in the extreme volatility seen earlier. The midline is at MB: 651.64 and the lower line at DN: 563.64.
Structural Floor: The fundamental technical support that strengthened the base of the previous trend remains firmly established at 537.25.
💡 Trading Strategy: Buy or Sell?
Buy (Long)?: This healthy correction and the approach to tactical support zones offer a more prudent opportunity to seek staggered entries, avoiding chasing the price at the highs. Management: Using a strict Stop Loss is mandatory to protect capital if the pullback extends.
Sell (Short)?: A high-risk counter-trend trade, since the macro and medium-term structure still favors buyers. It would only be considered under a confirmed breakdown of key structural supports.
#BNB #AnalisisTecnico #CryptoTrading
The Lord blesses and prospers those who operate here, in the name of Jesus, because your word says: "Mine is the silver, and mine is the gold," says the LORD of hosts." Hageo 2:8 RV1960-T -
$BNB
The daily chart of BNB/USDT shows a phase of correction and technical consolidation, trading at 690.86, which represents a -2.82% adjustment over the last 24 hours. Its daily trading range recorded a high of 714.15 and a low of 685.39, reflecting a logical cooldown after testing resistance levels close to the upper zone.
🔍 Trend Analysis and Indicators
Trend: Bullish short-term consolidation. The price is trading near the fast moving average MA(7) (700.39), maintaining solid structural room above MA(25) (640.58) and MA(99) (604.93).
Bollinger Bands: Price is pulling back from the upper zone and is trying to stabilize below the upper band in UP: 739.63, indicating moderation in the extreme volatility seen earlier. The midline is at MB: 651.64 and the lower line at DN: 563.64.
Structural Floor: The fundamental technical support that strengthened the base of the previous trend remains firmly established at 537.25.
💡 Trading Strategy: Buy or Sell?
Buy (Long)?: This healthy correction and the approach to tactical support zones offer a more prudent opportunity to seek staggered entries, avoiding chasing the price at the highs. Management: Using a strict Stop Loss is mandatory to protect capital if the pullback extends.
Sell (Short)?: A high-risk counter-trend trade, since the macro and medium-term structure still favors buyers. It would only be considered under a confirmed breakdown of key structural supports.
#BNB #AnalisisTecnico #CryptoTrading
The Lord blesses and prospers those who operate here, in the name of Jesus, because your word says: "Mine is the silver, and mine is the gold," says the LORD of hosts." Hageo 2:8 RV1960-T -
$BNB