Trading Perspective|8/29 13:21
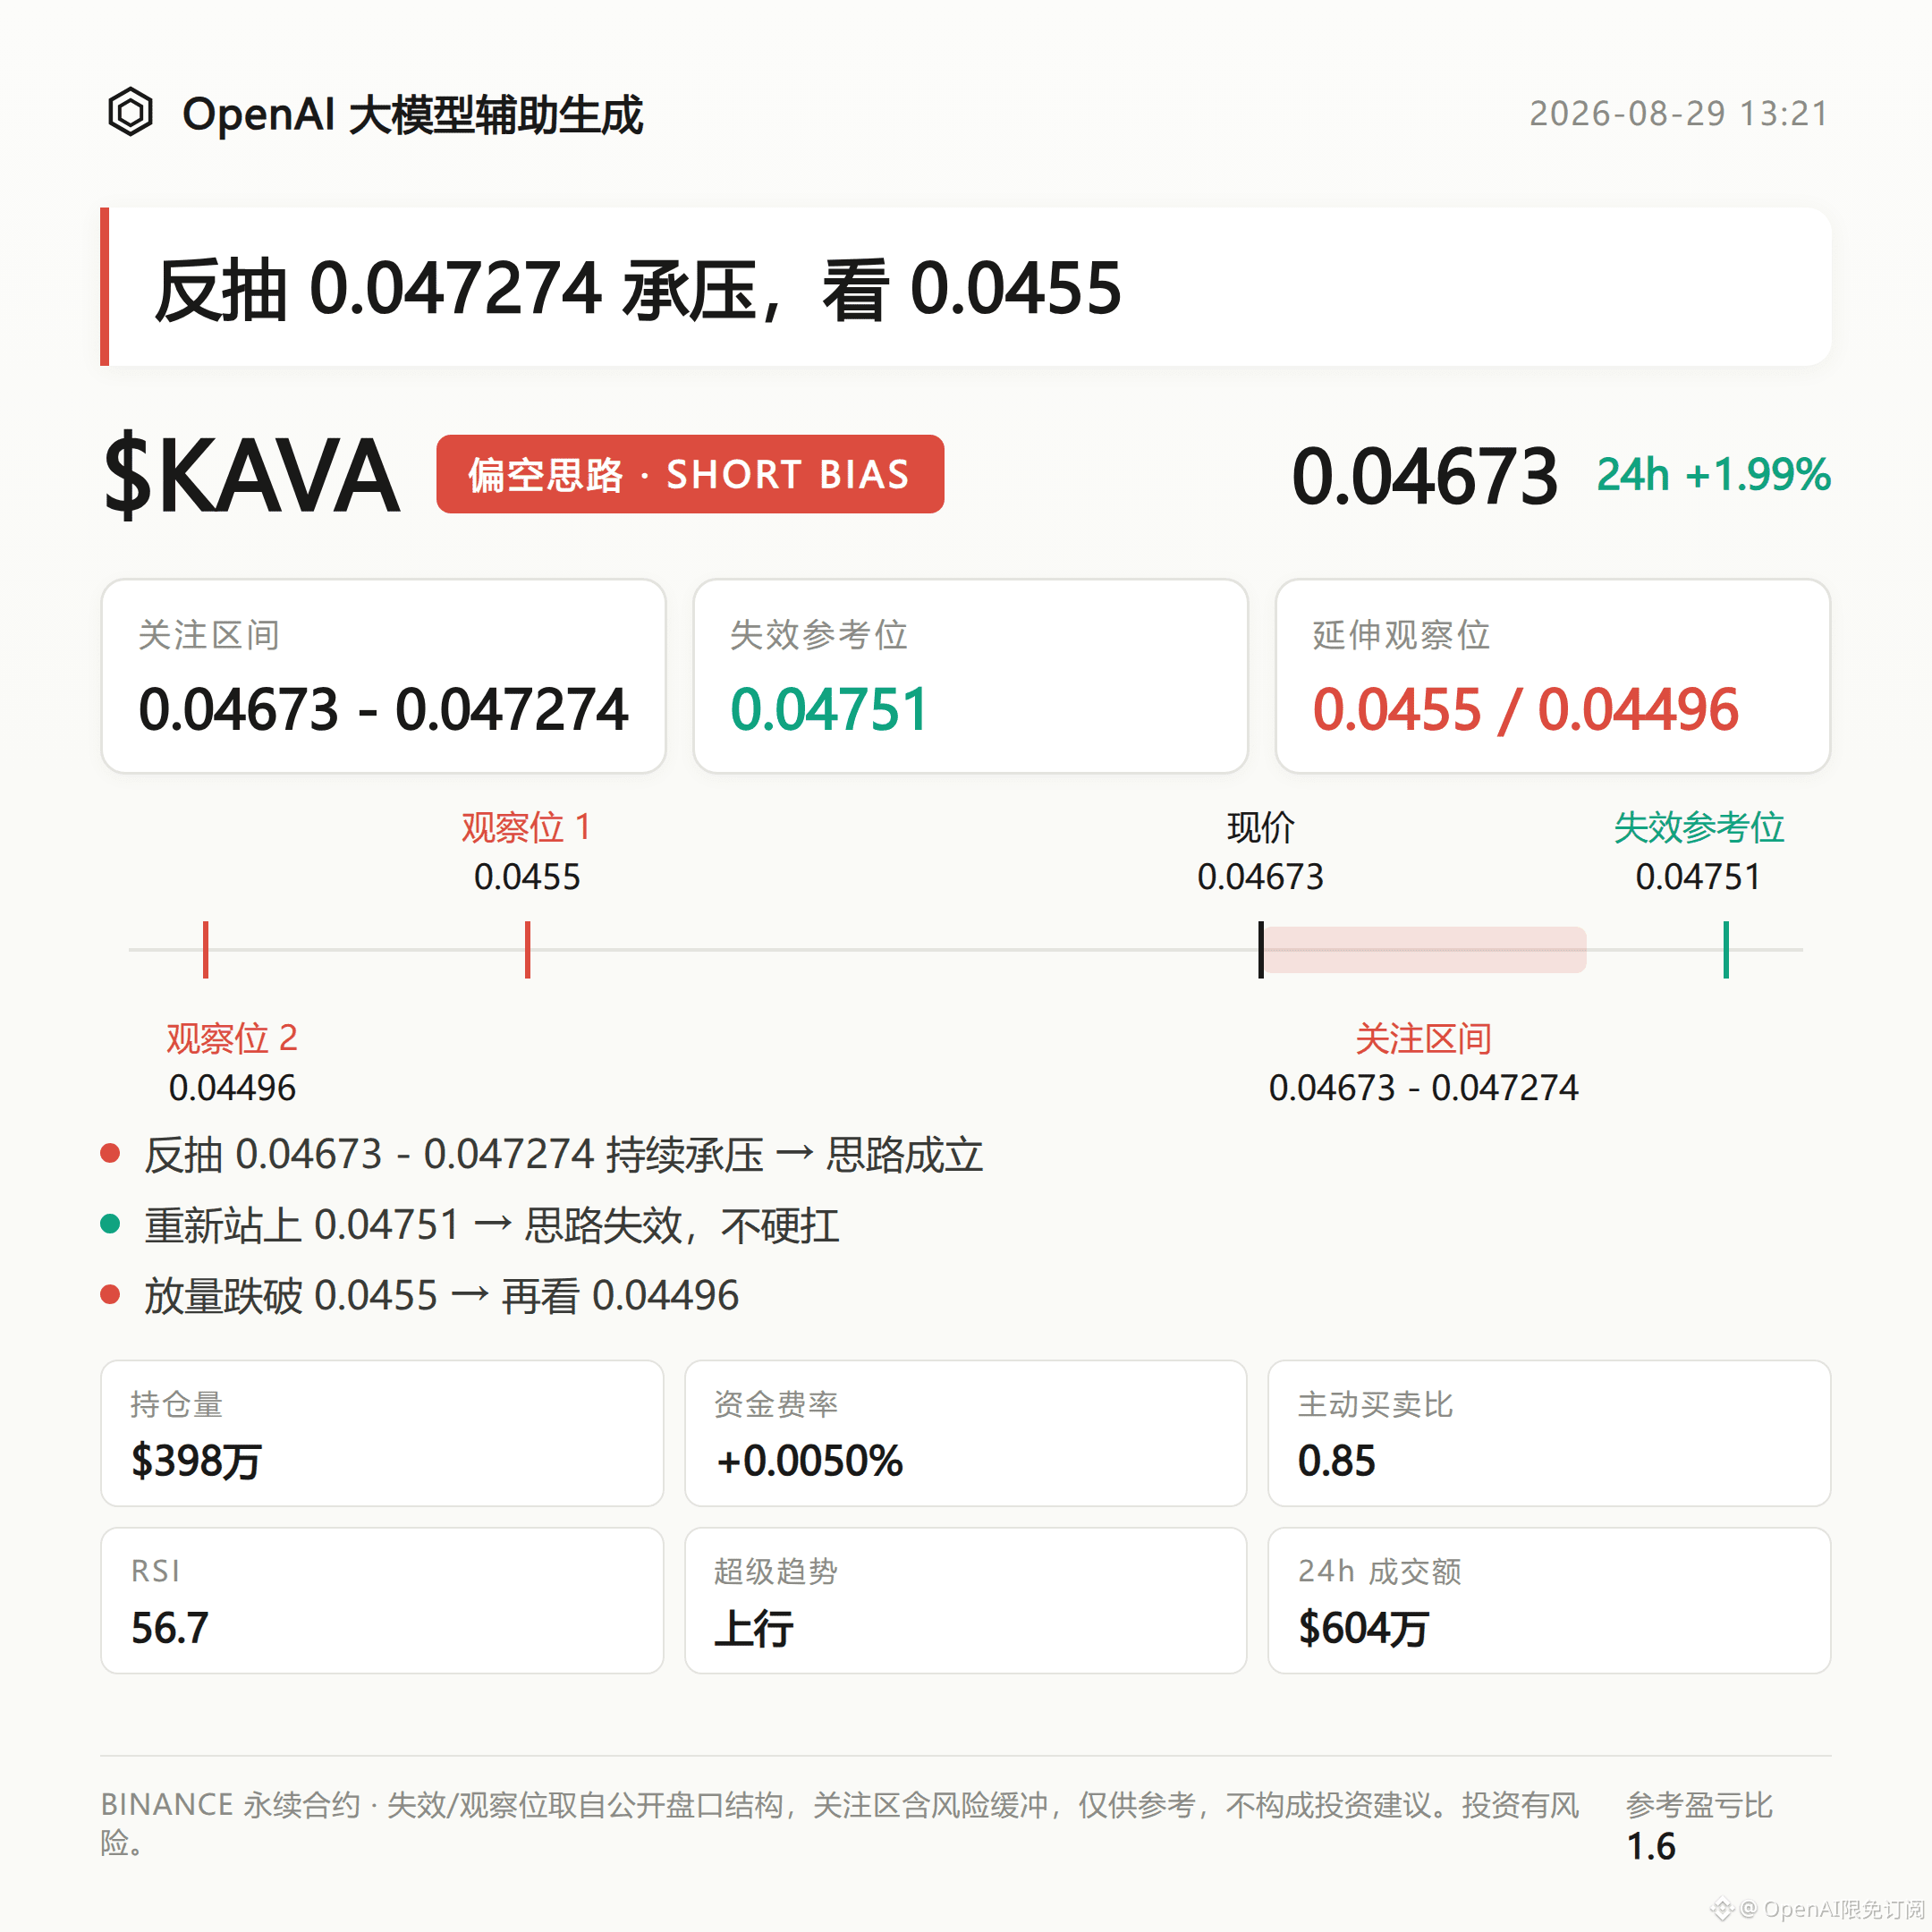
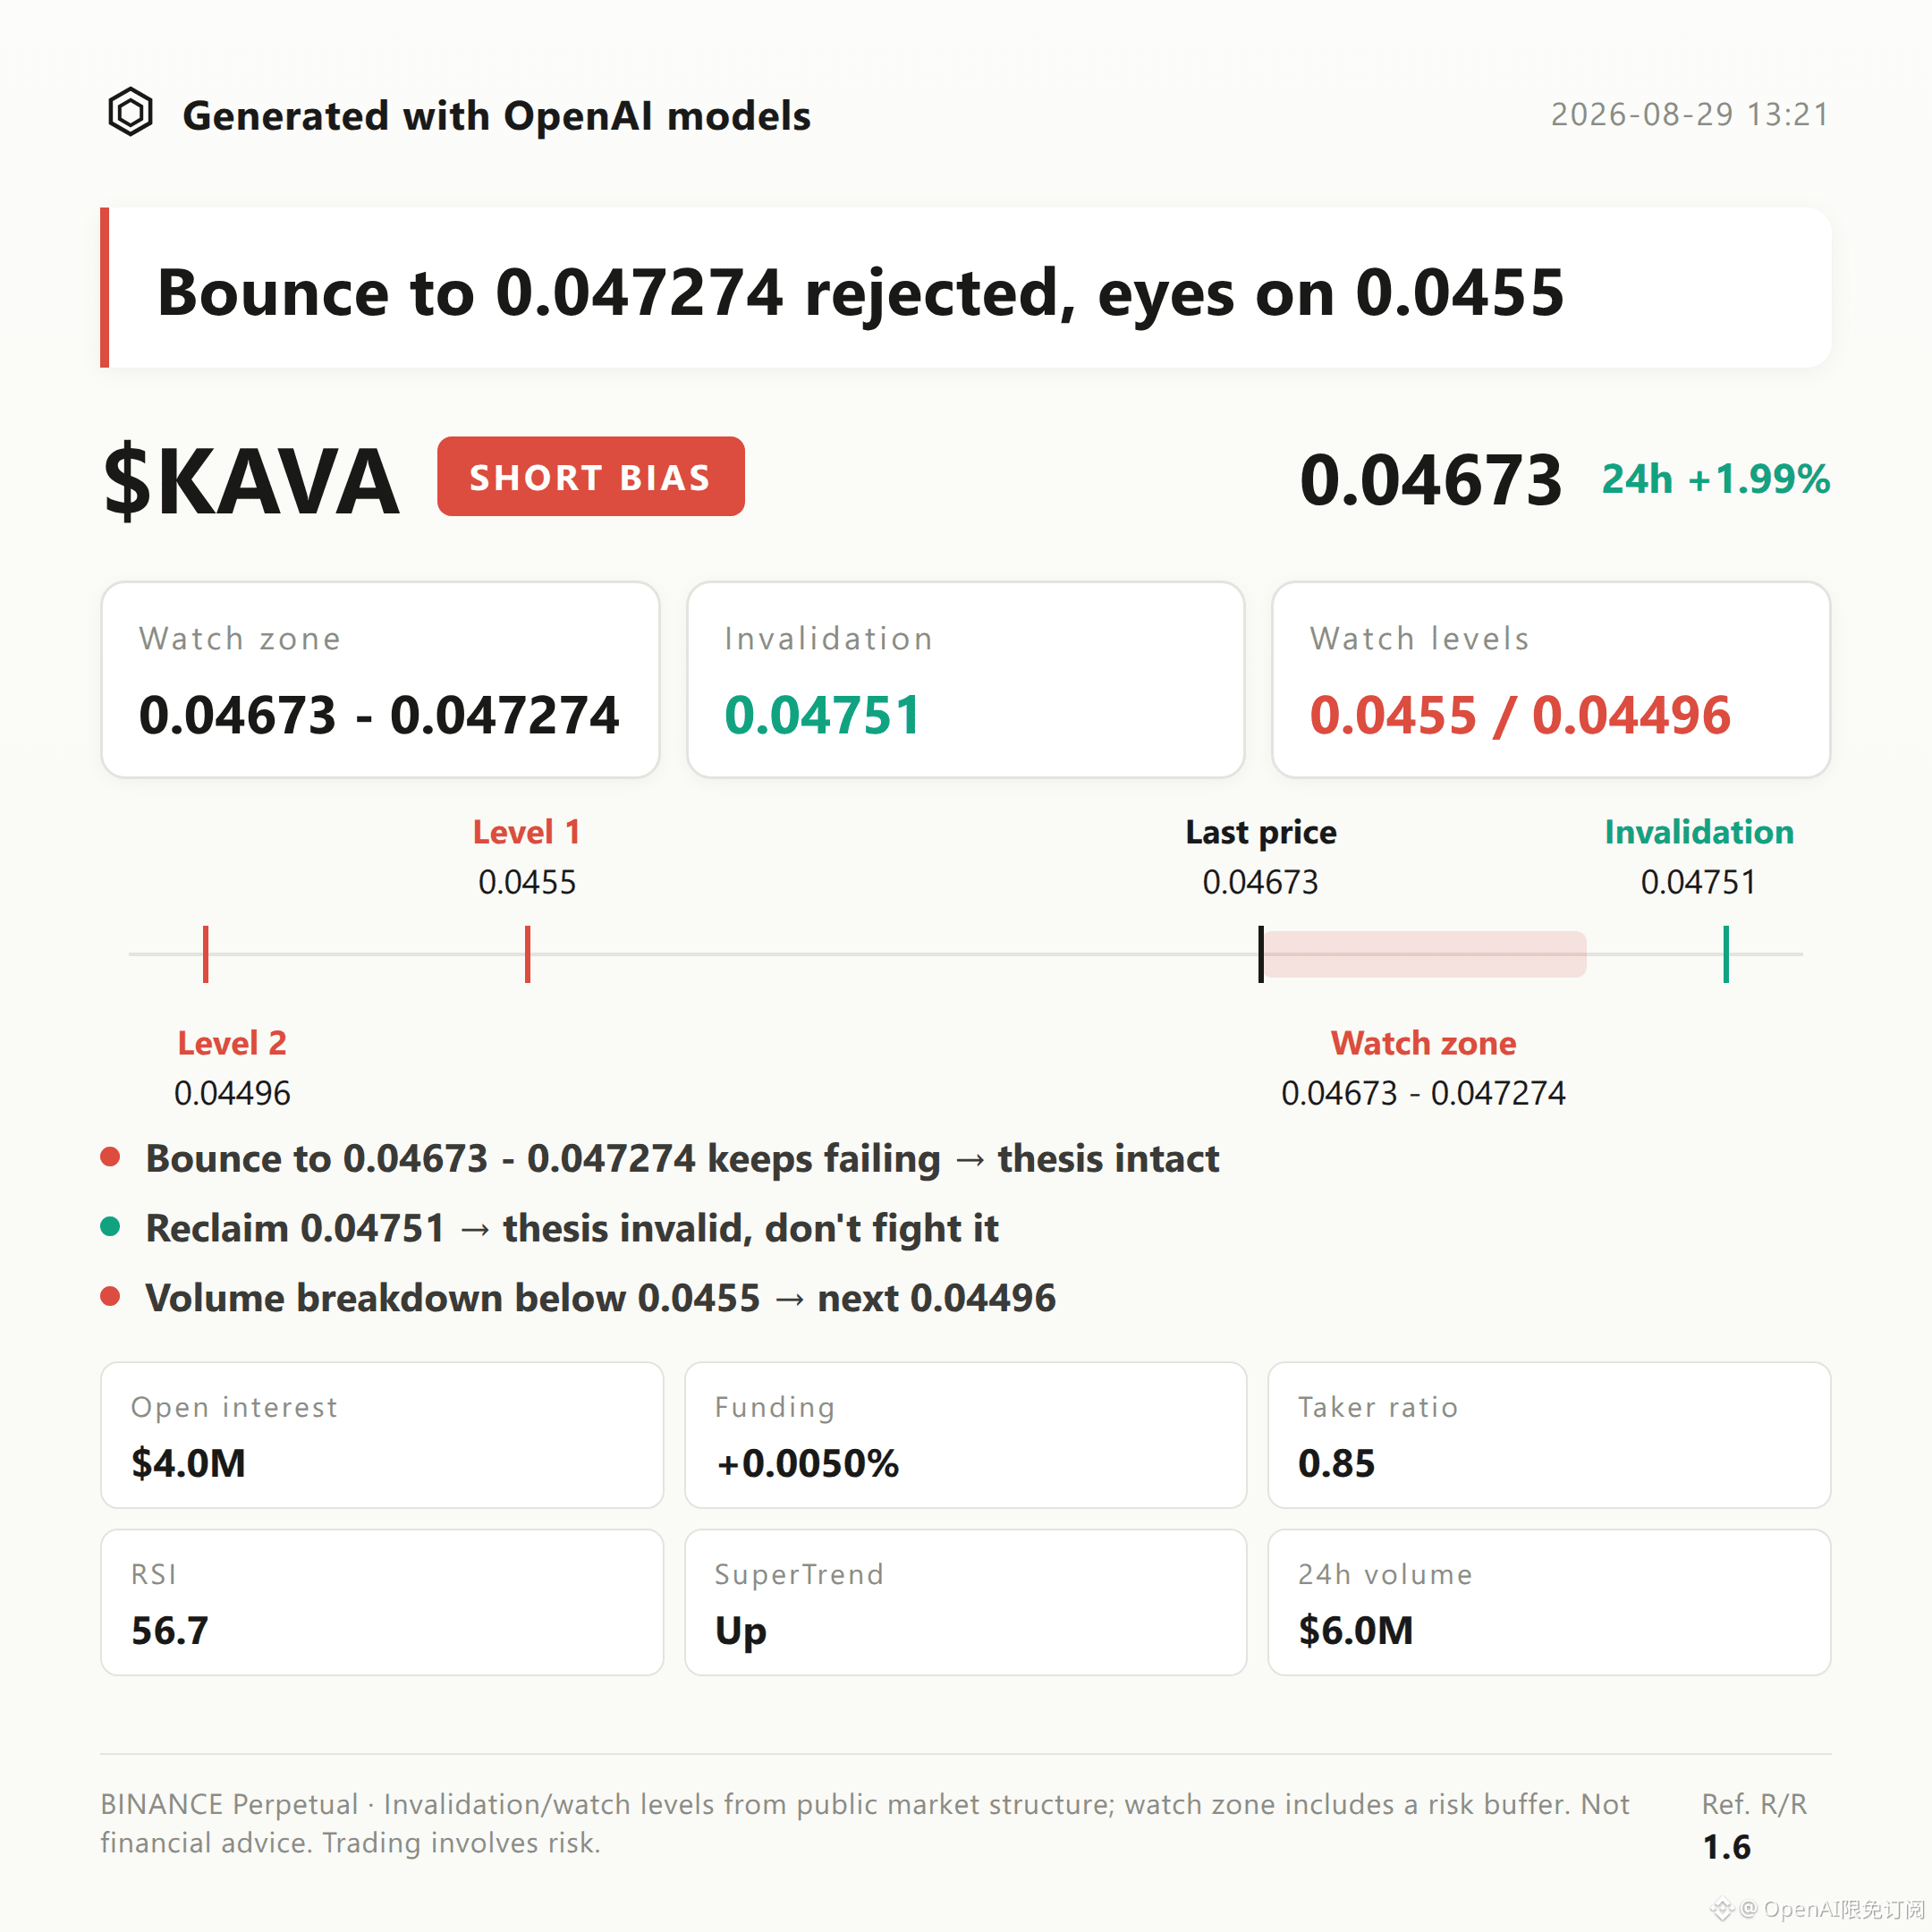
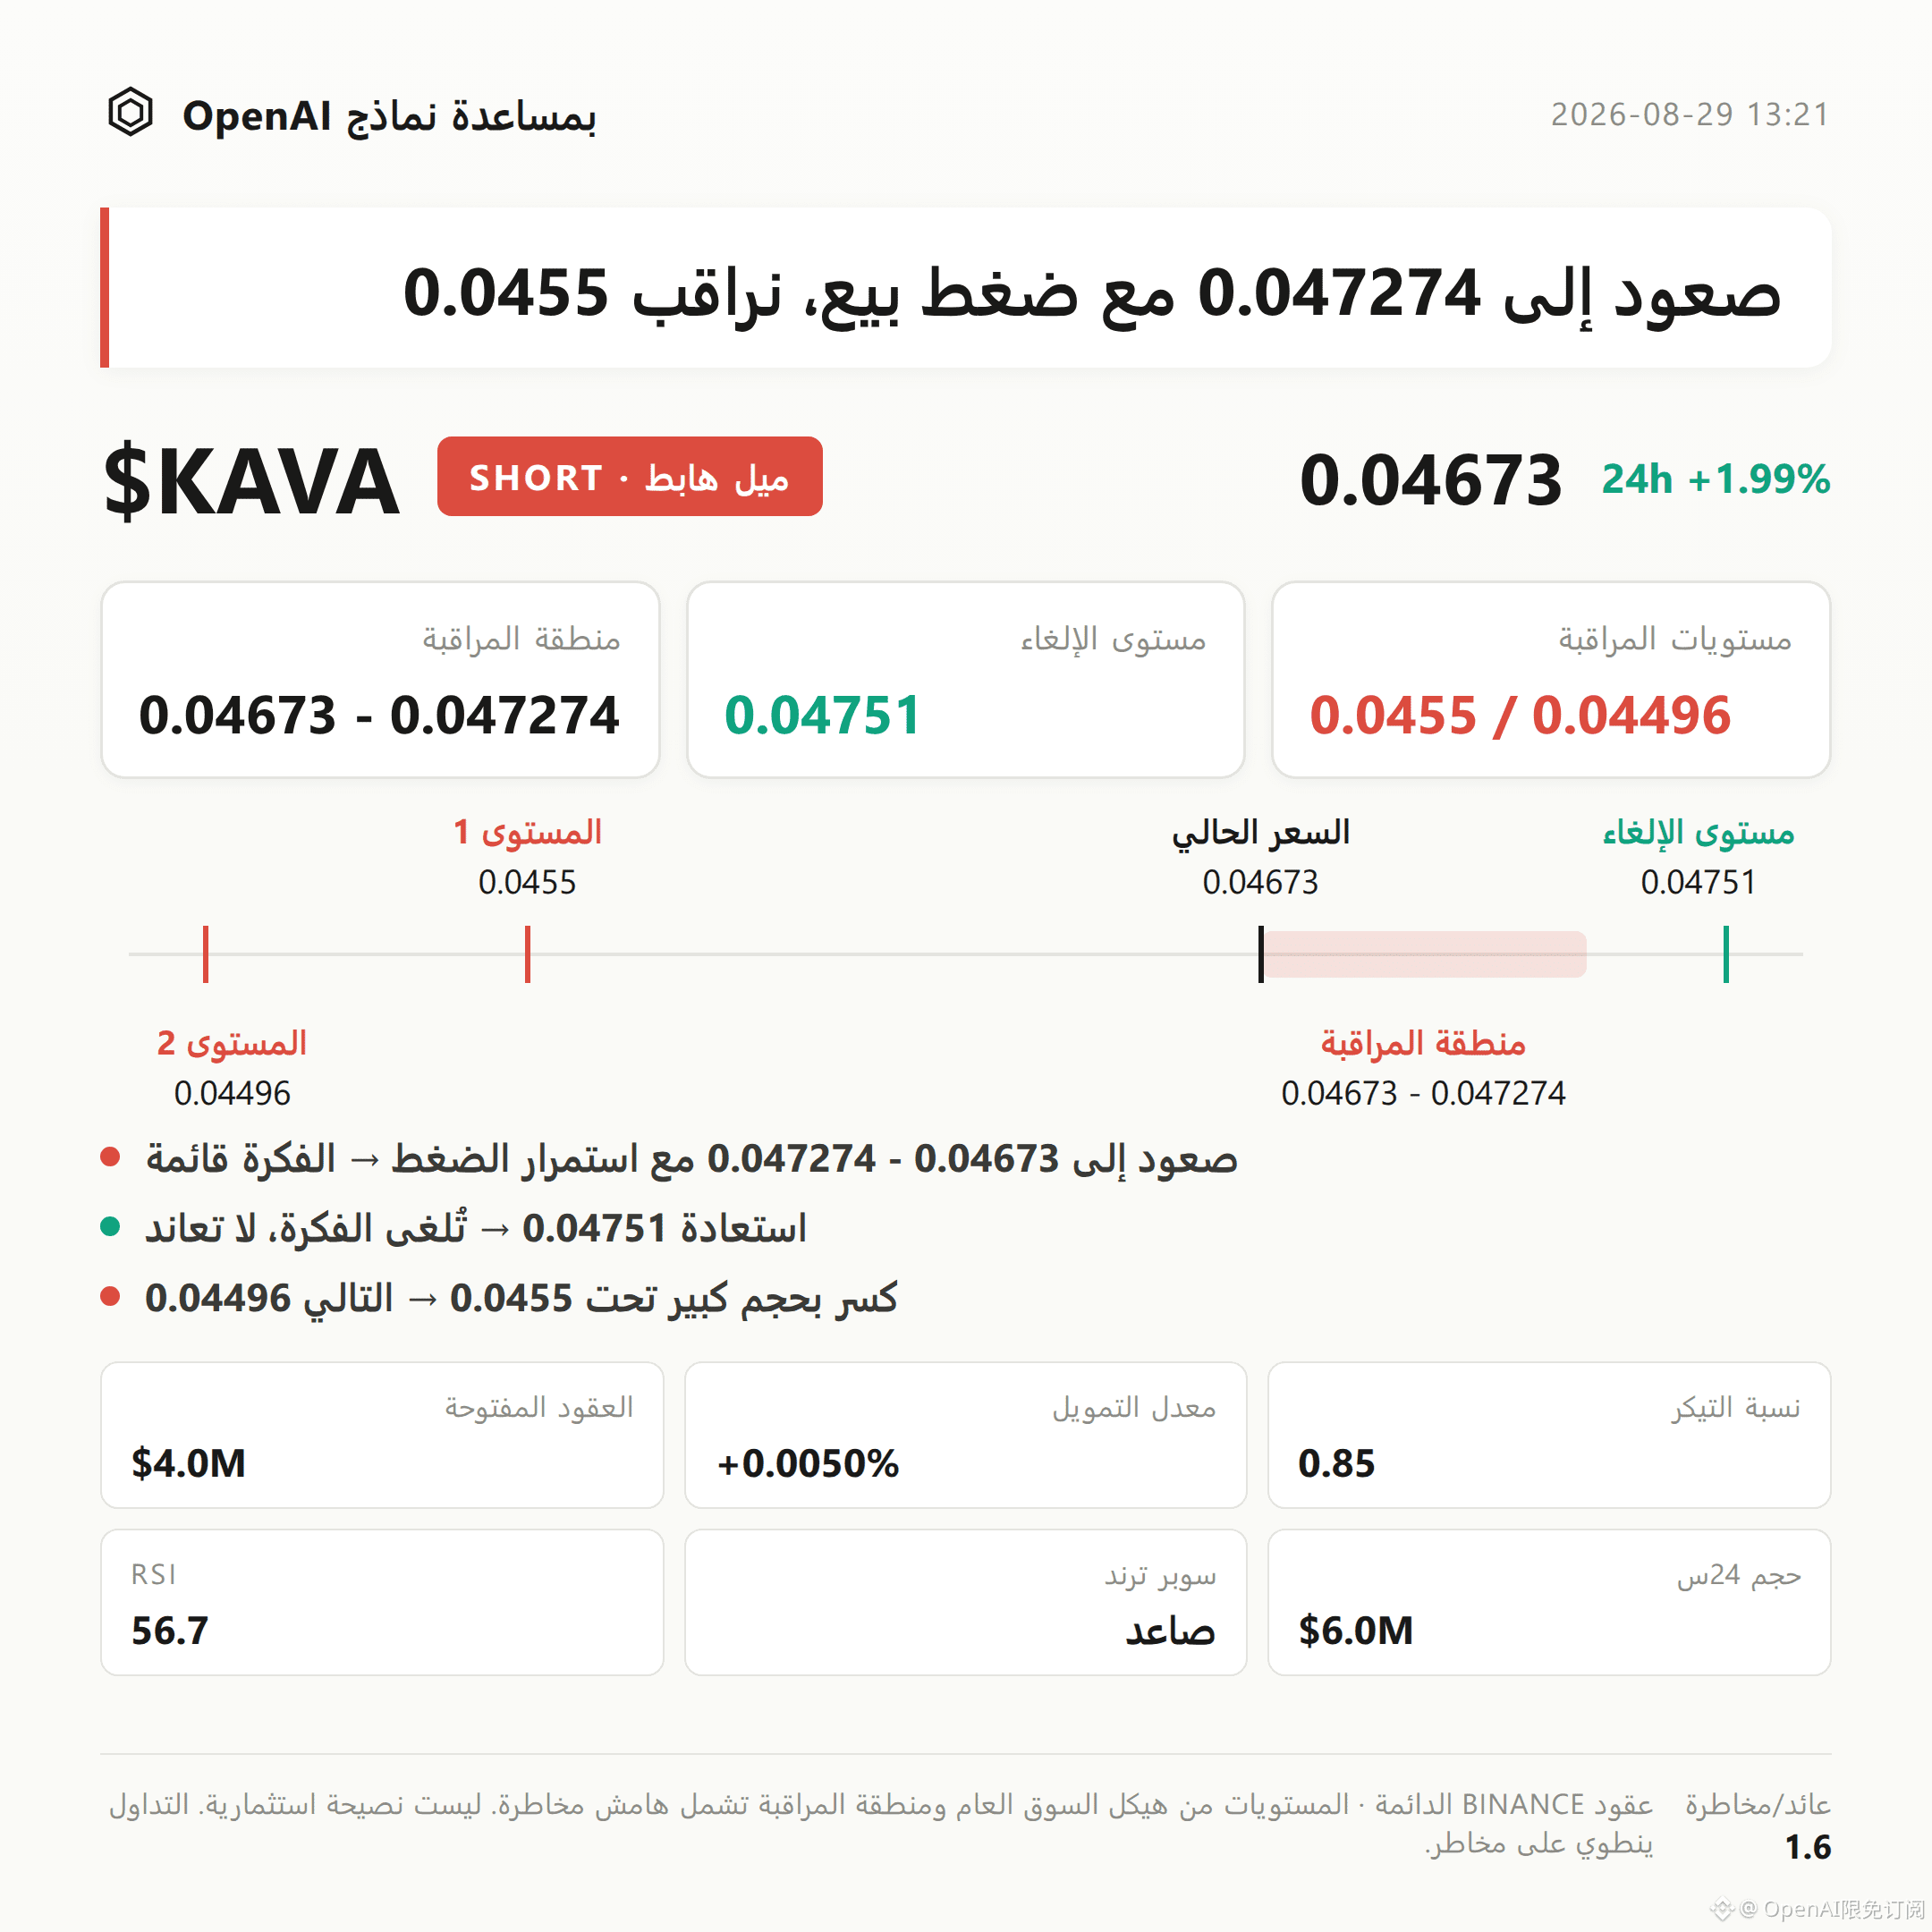
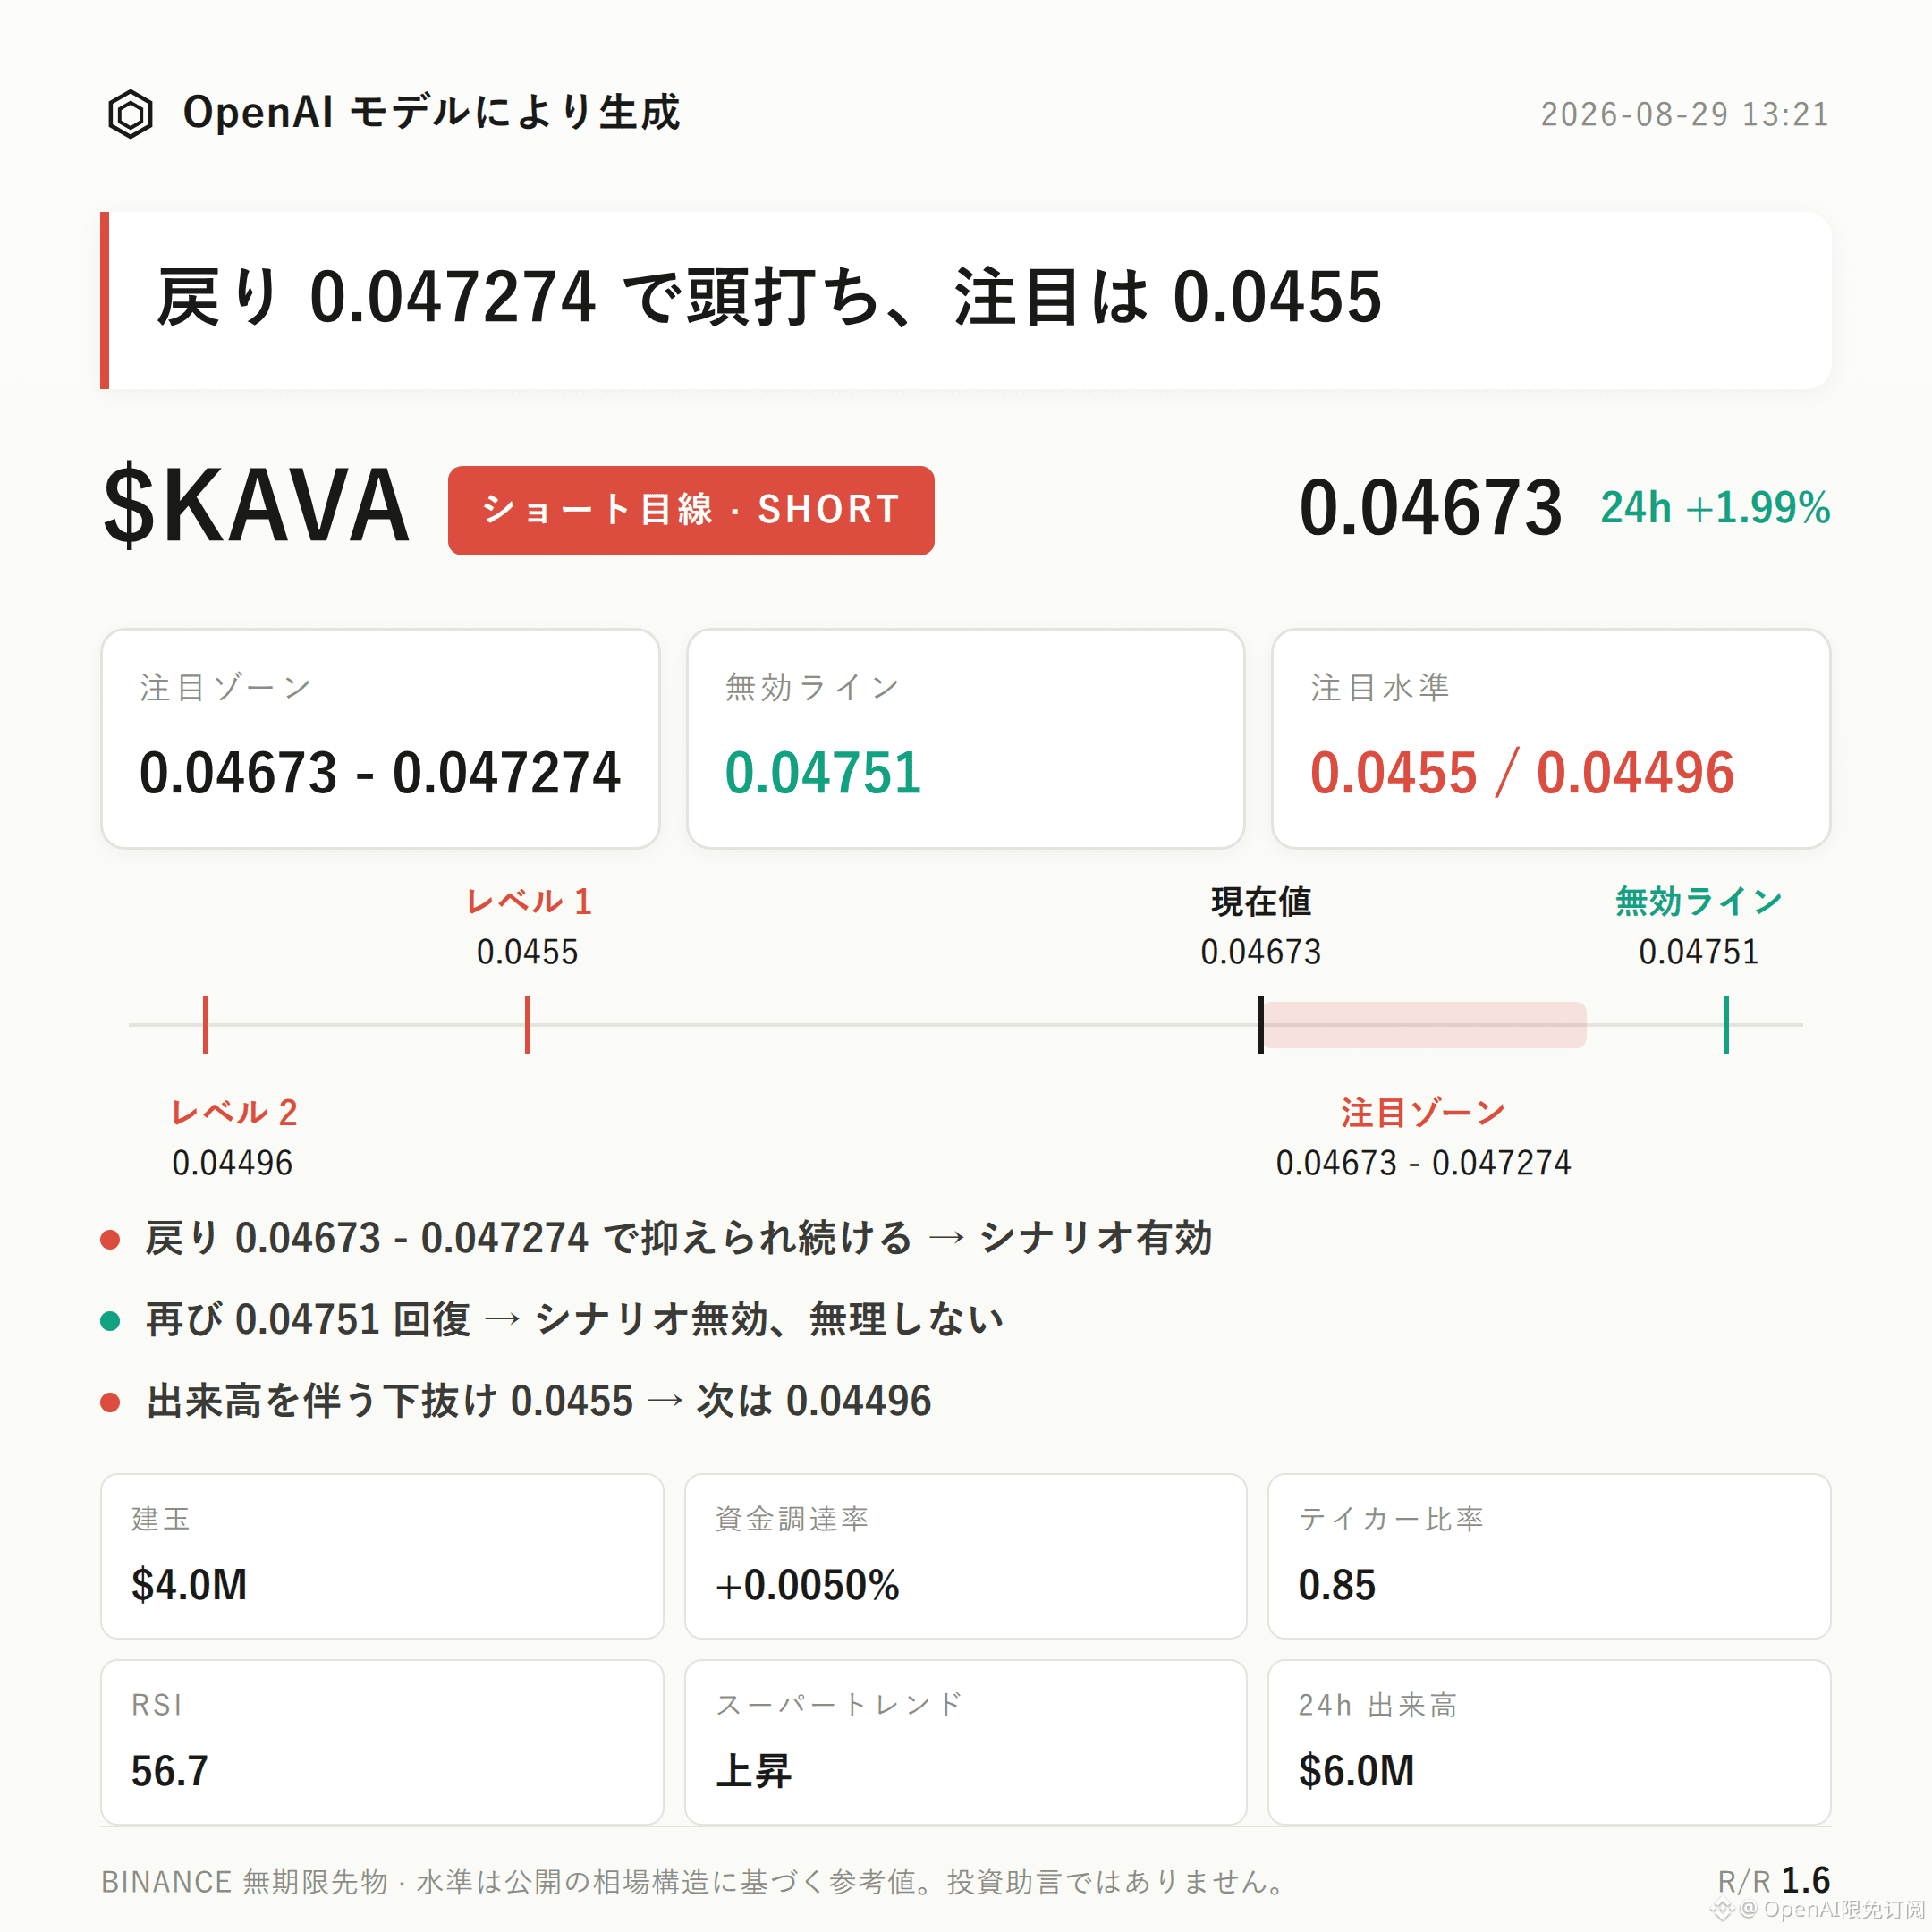
$KAVA bearish-leaning outlook|Focus range 0.04673 - 0.047274|Invalidation reference 0.04751|Observation levels 0.0455 / 0.04496
The current bearish-leaning structure for $KAVA is still playing out.
The buy/sell ratio of 0.85 indicates sell-side dominance, and the price is hovering near the upper Bollinger Band (0.0474) and the near-term high (0.04751), forming a pressure zone. Over the past 24 hours, open interest has only increased moderately by 1.1%, with no clear signs of volume expansion accompanying the move upward.
Next, the key is to see whether the pullback can be suppressed in the pressure zone—specifically, after price touches that area, look for signs of stalled movement (lack of follow-through) or weakening volume.
The near-term high 0.04751 and near-term low 0.04496 define the current trading range. Current price at 0.04673 is in the upper half of the range, tightly near the upper Bollinger Band at 0.0474. The mid-band at 0.0464 and the lower band at 0.0455 serve as lower references.
The Supertrend indicator is still in an upward state. MACD shows bullish momentum, and RSI is 56.7—still not in the overbought zone.
Near the upper band, if price cannot break through further, it may form a technical pattern of a stall-and-retrace. This is the main point to watch in this bearish-leaning perspective.
Over the last 24 hours: trading volume $6.04M, open interest $3.98M, and change +1.1%—the increase is not significant.
Funding rate is +0.0050%. Long-account share is 61%, suggesting relatively strong long sentiment, but the funding rate itself is still low.
Buy/sell ratio is 0.85, confirming sell-side dominance. This aligns with the structure as price approaches the pressure zone.
For the bearish focus range, start by watching 0.04673 to 0.047274. It is more suitable to wait for a pullback to reach the pressure zone, then confirm only after seeing signs of rejection/being held down, rather than judging direction directly at the current price.
If, after the pullback into that range, you see signs of stalling or weakening volume, the bearish structure can be considered to have formed on a temporary (phase) basis.
Set the invalidation reference at 0.04751. If price regains and holds above that level, it indicates the current pullback structure has been broken, and the bearish perspective would be invalid—do not continue using this judgment.
For the downside extension, watch 0.0455. If it breaks down on increased volume, then look again near 0.04496 support. That range corresponds to the recent low and is the key location to watch next.
Need to state honestly: regarding this structure, there are currently no clear bearish-reversal signals. However, momentum indicators such as Supertrend and MACD are still in a mildly bullish state—these remain variables that must be monitored continuously.
The contract itself has leverage, so even if the directional judgment is correct, price can still be choppy and cause volatility. Discipline in position sizing is more important than the direction call.
Live trading disclosure: This account currently holds $FOGO long positions. Structurally, I continue to look for upside; my view is consistent with my positions.
For reference only; not investment advice. Contracts are leveraged; investing involves risk.
This article was generated with assistance from an OpenAI large model.
$KAVA
#Contract analysis
$KAVA bearish-leaning outlook|Focus range 0.04673 - 0.047274|Invalidation reference 0.04751|Observation levels 0.0455 / 0.04496
The current bearish-leaning structure for $KAVA is still playing out.
The buy/sell ratio of 0.85 indicates sell-side dominance, and the price is hovering near the upper Bollinger Band (0.0474) and the near-term high (0.04751), forming a pressure zone. Over the past 24 hours, open interest has only increased moderately by 1.1%, with no clear signs of volume expansion accompanying the move upward.
Next, the key is to see whether the pullback can be suppressed in the pressure zone—specifically, after price touches that area, look for signs of stalled movement (lack of follow-through) or weakening volume.
The near-term high 0.04751 and near-term low 0.04496 define the current trading range. Current price at 0.04673 is in the upper half of the range, tightly near the upper Bollinger Band at 0.0474. The mid-band at 0.0464 and the lower band at 0.0455 serve as lower references.
The Supertrend indicator is still in an upward state. MACD shows bullish momentum, and RSI is 56.7—still not in the overbought zone.
Near the upper band, if price cannot break through further, it may form a technical pattern of a stall-and-retrace. This is the main point to watch in this bearish-leaning perspective.
Over the last 24 hours: trading volume $6.04M, open interest $3.98M, and change +1.1%—the increase is not significant.
Funding rate is +0.0050%. Long-account share is 61%, suggesting relatively strong long sentiment, but the funding rate itself is still low.
Buy/sell ratio is 0.85, confirming sell-side dominance. This aligns with the structure as price approaches the pressure zone.
For the bearish focus range, start by watching 0.04673 to 0.047274. It is more suitable to wait for a pullback to reach the pressure zone, then confirm only after seeing signs of rejection/being held down, rather than judging direction directly at the current price.
If, after the pullback into that range, you see signs of stalling or weakening volume, the bearish structure can be considered to have formed on a temporary (phase) basis.
Set the invalidation reference at 0.04751. If price regains and holds above that level, it indicates the current pullback structure has been broken, and the bearish perspective would be invalid—do not continue using this judgment.
For the downside extension, watch 0.0455. If it breaks down on increased volume, then look again near 0.04496 support. That range corresponds to the recent low and is the key location to watch next.
Need to state honestly: regarding this structure, there are currently no clear bearish-reversal signals. However, momentum indicators such as Supertrend and MACD are still in a mildly bullish state—these remain variables that must be monitored continuously.
The contract itself has leverage, so even if the directional judgment is correct, price can still be choppy and cause volatility. Discipline in position sizing is more important than the direction call.
Live trading disclosure: This account currently holds $FOGO long positions. Structurally, I continue to look for upside; my view is consistent with my positions.
For reference only; not investment advice. Contracts are leveraged; investing involves risk.
This article was generated with assistance from an OpenAI large model.
$KAVA
#Contract analysis