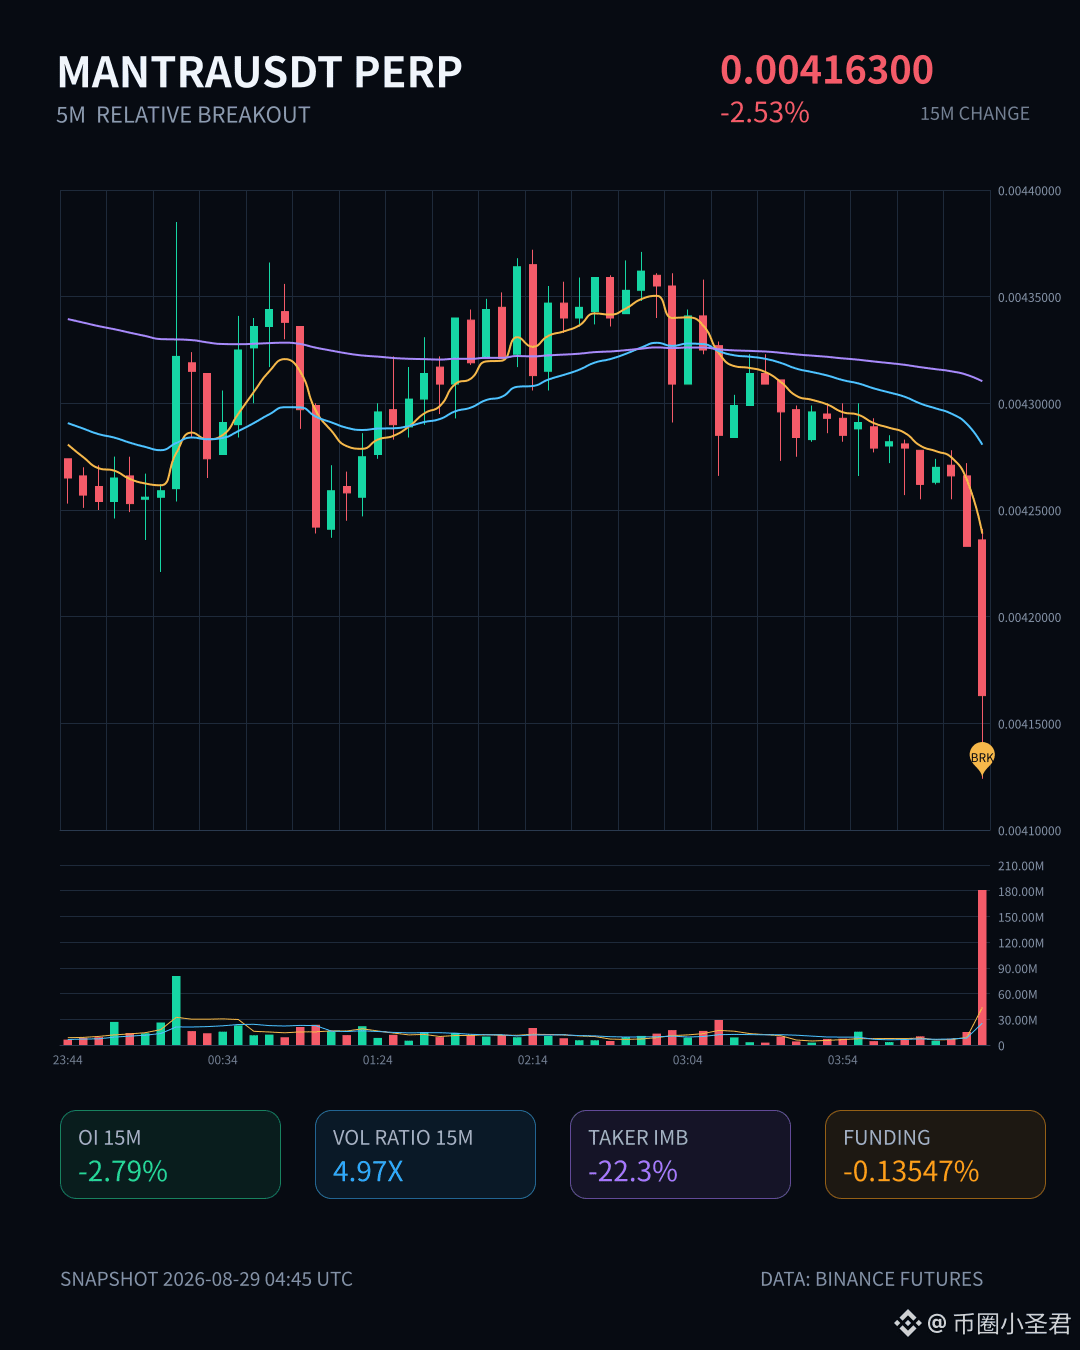
$MANTRA This sell-off is clean and decisive.
In just 15 minutes, it’s down -2.53%, with volume up to 4.97x, and the volatility Z reaching 3.36—this is a classic “high-volume breakdown” move. The key point is that OI also dropped a lot: 15m -2.79%, with nominal change -199K. This combination looks more like longs being forced to cut positions rather than new shorts rushing in to hammer the market.
The active trade spread is -22.3%, the buy/sell ratio is 0.64, and the closing price also confirms it has broken below the lower bound of the last ~20 consecutive 5m K-bars. The funding rate is still in a high percentile, which suggests the people who were long are now very uncomfortable.
The order book data is also not simple: the abnormality level in the whole pool ranks #6, and the nominal change ranks #21—neither is a small move. Moreover, this abnormal percentile is 95.6%, which puts it in a very extreme range recently.
Honestly, this setup—“high volume down + OI contraction + funding rate high”—looks more like leverage clearing than a genuine trend reversal. But the chart still has some things hanging in the air. Don’t rush to bottom-fish; first see whether it can hold the prior support zone.
In just 15 minutes, it’s down -2.53%, with volume up to 4.97x, and the volatility Z reaching 3.36—this is a classic “high-volume breakdown” move. The key point is that OI also dropped a lot: 15m -2.79%, with nominal change -199K. This combination looks more like longs being forced to cut positions rather than new shorts rushing in to hammer the market.
The active trade spread is -22.3%, the buy/sell ratio is 0.64, and the closing price also confirms it has broken below the lower bound of the last ~20 consecutive 5m K-bars. The funding rate is still in a high percentile, which suggests the people who were long are now very uncomfortable.
The order book data is also not simple: the abnormality level in the whole pool ranks #6, and the nominal change ranks #21—neither is a small move. Moreover, this abnormal percentile is 95.6%, which puts it in a very extreme range recently.
Honestly, this setup—“high volume down + OI contraction + funding rate high”—looks more like leverage clearing than a genuine trend reversal. But the chart still has some things hanging in the air. Don’t rush to bottom-fish; first see whether it can hold the prior support zone.