$ETH
🔥 ETH/USDT — Brief Analysis
📅 August 29, 2026
Tables
Parameter
Value
💰 Current Price
$2,438
📉 24h
−2.12% (−$52.89)
📈 Month
+30.9% (+$575)
🏔️ Max (30d)
$2,567
🕳️ Min (30d)
$1,822
📊 RSI(14)
78.3 (overbought)
📊 What’s happening
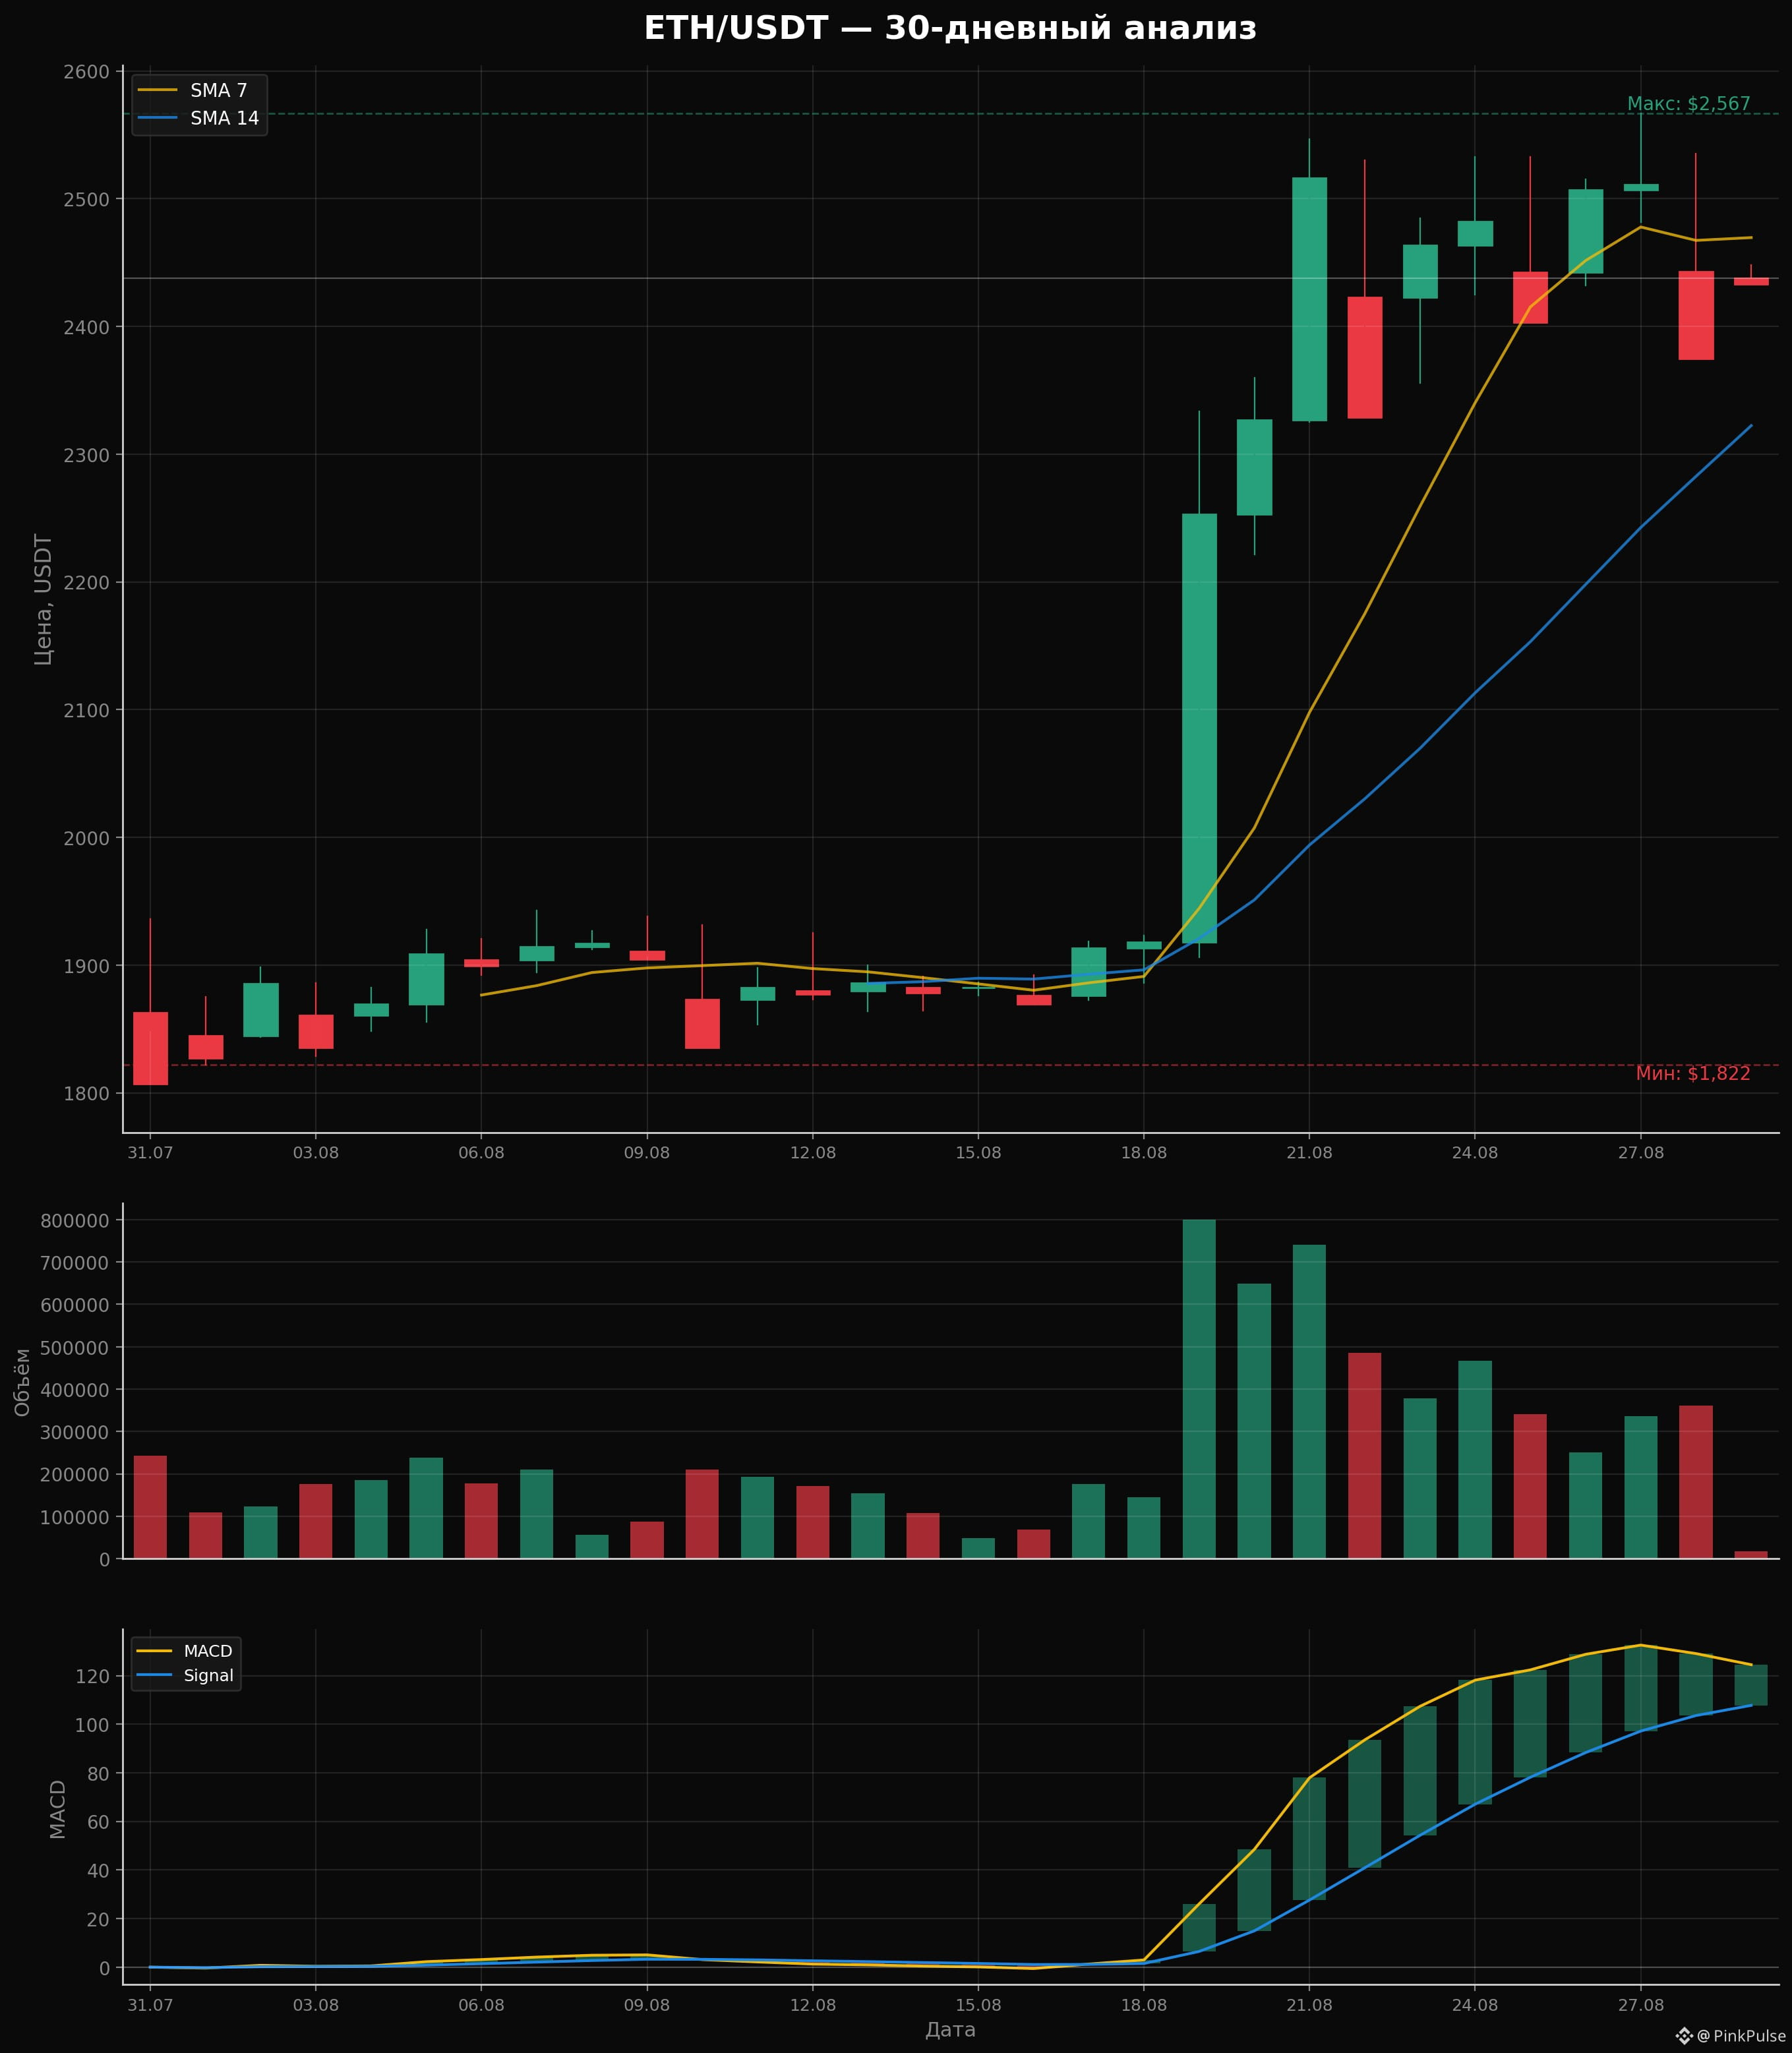
Explosive growth + correction. Since August 19, ETH has surged from 1,918 to a peak of 2,567 (+33% in 3 days) on record volumes. Now there is a healthy consolidation in the 2,400–2,550 range.
Technical indicators:
RSI 78.3 — overbought zone; a correction is likely
MACD — bullish, but the histogram is shrinking (a weakening impulse signal)
SMA 7 above SMA 14 — short-term trend is bullish
Levels:
🟢 Support: 2,400 →2,350 → $2,220
🔴 Resistance: 2,530 →2,567 (local high)
💡 Conclusion
Tap $ETH and subscribe — it keeps a bullish structure after a strong impulse. The current −2% correction is a normal consolidation after +30% for the month. RSI being overbought warns of a possible further pullback to 2,350–2,400. If 2,400 holds, the next target is 2,600+.
⚠️ Not financial advice. DYOR.
🔥 ETH/USDT — Brief Analysis
📅 August 29, 2026
Tables
Parameter
Value
💰 Current Price
$2,438
📉 24h
−2.12% (−$52.89)
📈 Month
+30.9% (+$575)
🏔️ Max (30d)
$2,567
🕳️ Min (30d)
$1,822
📊 RSI(14)
78.3 (overbought)
📊 What’s happening
Explosive growth + correction. Since August 19, ETH has surged from 1,918 to a peak of 2,567 (+33% in 3 days) on record volumes. Now there is a healthy consolidation in the 2,400–2,550 range.
Technical indicators:
RSI 78.3 — overbought zone; a correction is likely
MACD — bullish, but the histogram is shrinking (a weakening impulse signal)
SMA 7 above SMA 14 — short-term trend is bullish
Levels:
🟢 Support: 2,400 →2,350 → $2,220
🔴 Resistance: 2,530 →2,567 (local high)
💡 Conclusion
Tap $ETH and subscribe — it keeps a bullish structure after a strong impulse. The current −2% correction is a normal consolidation after +30% for the month. RSI being overbought warns of a possible further pullback to 2,350–2,400. If 2,400 holds, the next target is 2,600+.
⚠️ Not financial advice. DYOR.