$BTC
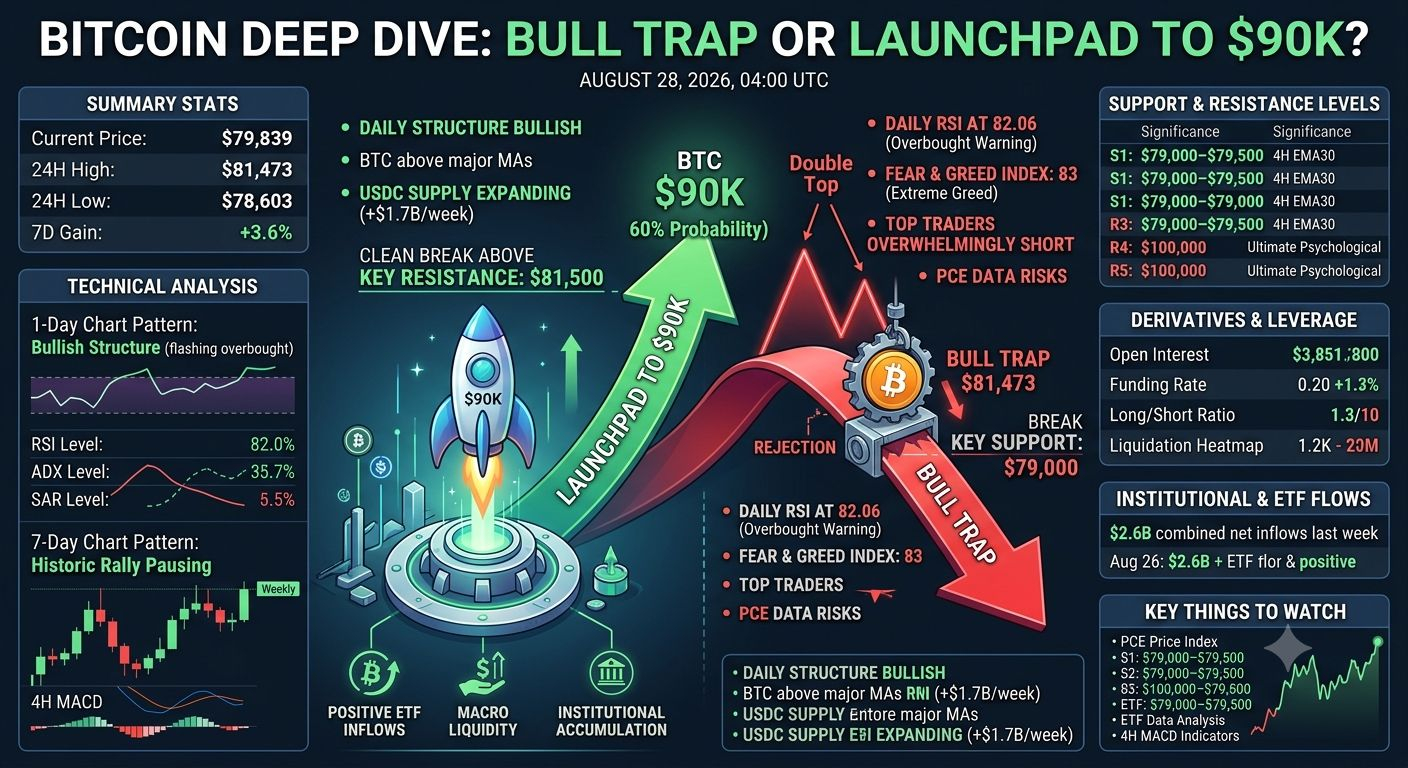
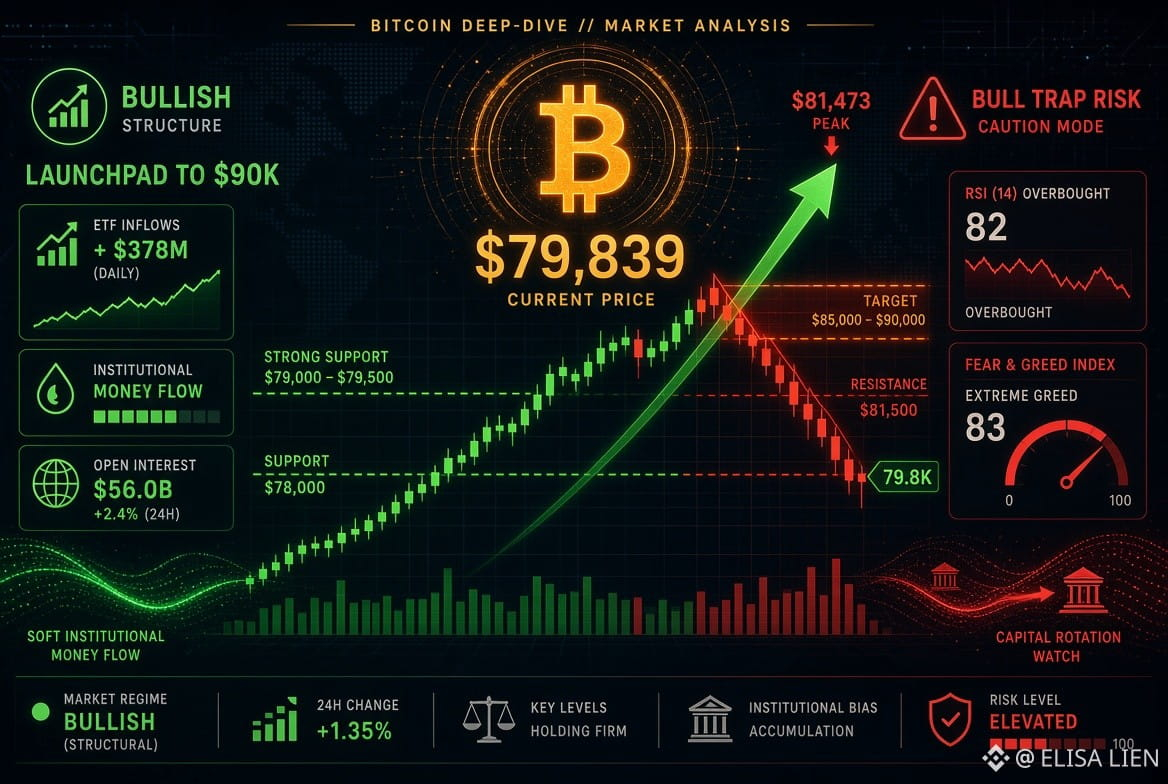
Current BTC Situation: 79.839 USD, 24-hour high of 81.473 USD, and after a sharp rally, BTC is now experiencing a pullback.
1-Day Chart — What Does It Show? Bullish Yet Overbought.
On the daily chart, BTC has formed 7 consecutive green candles and the price is above all the main moving averages — EMA7, EMA30, EMA120, and EMA200 — which is a sign of bullish structure. ADX is at 47.16, confirming a strong trend. The daily SAR is at 71,267 USD, providing a solid foundation for the uptrend. However, RSI is at 82.06, far into the overbought zone. Historical data shows that when the daily RSI moves above 80, a sharp pullback or sideways consolidation often follows — but that does not mean the rally is over; it simply means the market needs to cool down. The upper daily Bollinger Band is at 83,500 USD, and the price is being traded near the upper band, meaning strong momentum, but the risk of exhaustion is also increasing.
7-Day Chart — What Does It Show? A Historic Rally Entering a Consolidation Phase.
This is one of the largest weekly increases in BTC’s history — a move of 16,000 USD in one week, reflecting a 22.7% rise. It happened from August 18 to August 25, and after such a strong rally, the market is now entering a natural consolidation phase. The MACD on the 4-hour chart has turned negative, indicating weakening short-term momentum. The 4-hour MA alignment has become neutral, meaning bulls and bears are fighting around this level. The key point, however, is that the 7-day structure is still bullish, but the pace of the rally is not sustainable. The 79,000–79,500 USD zone has been tested repeatedly and has held. This is an important short-term boundary. As long as BTC stays above 79,000 USD, the pullback from 81,473 USD is a healthy retracement, not a change of direction.$DEXE
$BEAT
.
Current BTC Situation: 79.839 USD, 24-hour high of 81.473 USD, and after a sharp rally, BTC is now experiencing a pullback.
1-Day Chart — What Does It Show? Bullish Yet Overbought.
On the daily chart, BTC has formed 7 consecutive green candles and the price is above all the main moving averages — EMA7, EMA30, EMA120, and EMA200 — which is a sign of bullish structure. ADX is at 47.16, confirming a strong trend. The daily SAR is at 71,267 USD, providing a solid foundation for the uptrend. However, RSI is at 82.06, far into the overbought zone. Historical data shows that when the daily RSI moves above 80, a sharp pullback or sideways consolidation often follows — but that does not mean the rally is over; it simply means the market needs to cool down. The upper daily Bollinger Band is at 83,500 USD, and the price is being traded near the upper band, meaning strong momentum, but the risk of exhaustion is also increasing.
7-Day Chart — What Does It Show? A Historic Rally Entering a Consolidation Phase.
This is one of the largest weekly increases in BTC’s history — a move of 16,000 USD in one week, reflecting a 22.7% rise. It happened from August 18 to August 25, and after such a strong rally, the market is now entering a natural consolidation phase. The MACD on the 4-hour chart has turned negative, indicating weakening short-term momentum. The 4-hour MA alignment has become neutral, meaning bulls and bears are fighting around this level. The key point, however, is that the 7-day structure is still bullish, but the pace of the rally is not sustainable. The 79,000–79,500 USD zone has been tested repeatedly and has held. This is an important short-term boundary. As long as BTC stays above 79,000 USD, the pullback from 81,473 USD is a healthy retracement, not a change of direction.$DEXE
$BEAT
.