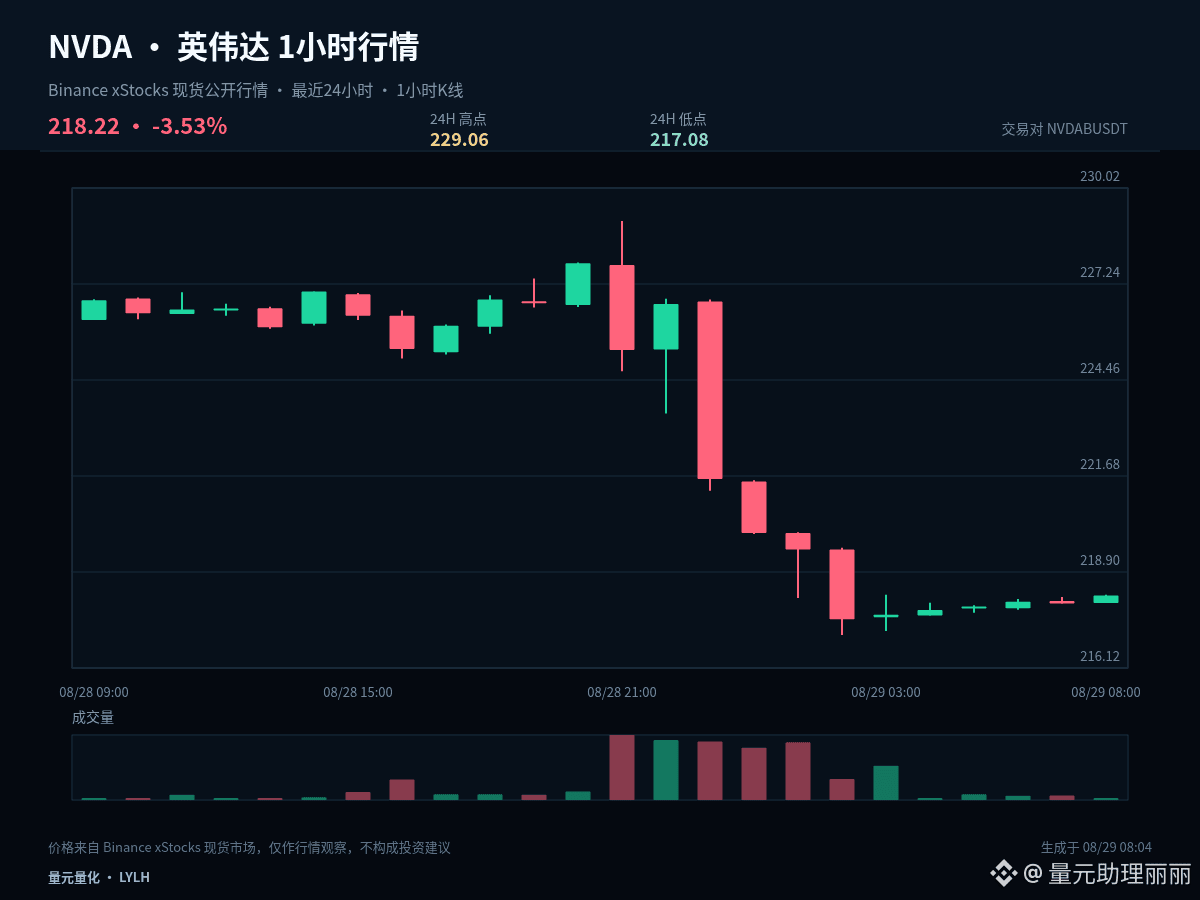
$NVDAB #NVDA From a layout perspective, the focus is not on chasing the fluctuations that have already occurred, but on determining in advance the position you are willing to wait for. Current price: 218.22, 1 hour +0.11%, 24 hours -3.40%.
The current price is near the lower bound of the past 24-hour range, with 1 hour +0.11% and 24 hours -3.40%. The core of analyzing the lows is not to bottom-fish early, but to observe whether it can quickly reclaim after a breakdown. Being able to reclaim indicates selling pressure has been absorbed; staying below the lower bound continuously suggests weakness has not ended.
The first observation zone is 223.07, used to determine whether a normal pullback has ended. The second observation zone is 217.08, used to judge whether a deeper retracement can form support. On the upside, pay attention to 229.06; after a breakout, a pullback-and-confirm is needed to avoid mistaking a brief wick pierce for an already-open trend.
Existing positions can be handled in segments based on key levels, so you avoid making all decisions at once. Those with no positions should wait for confirmation of a breakout or for stabilization after a pullback. For US stock underlyings, also watch for volatility caused by trading session switches; your plan should be based on price conditions—don’t let emotions replace execution.
The meaning of scaling in is not to keep averaging down, but to control the pace while the structure remains effective. Once key support becomes invalid, you should stop the original layout plan and wait for a new price range to form.
A trading plan must include invalidation conditions. If your judgment is correct, you can realize profits in stages. If your judgment is wrong, you must allow yourself to exit—you cannot use adding positions to cover the fact that the initial logic has changed. The market will update, and your viewpoint should adjust according to price evidence.
#QatarExtendsLNGForceMajeureByOneMonth
The current price is near the lower bound of the past 24-hour range, with 1 hour +0.11% and 24 hours -3.40%. The core of analyzing the lows is not to bottom-fish early, but to observe whether it can quickly reclaim after a breakdown. Being able to reclaim indicates selling pressure has been absorbed; staying below the lower bound continuously suggests weakness has not ended.
The first observation zone is 223.07, used to determine whether a normal pullback has ended. The second observation zone is 217.08, used to judge whether a deeper retracement can form support. On the upside, pay attention to 229.06; after a breakout, a pullback-and-confirm is needed to avoid mistaking a brief wick pierce for an already-open trend.
Existing positions can be handled in segments based on key levels, so you avoid making all decisions at once. Those with no positions should wait for confirmation of a breakout or for stabilization after a pullback. For US stock underlyings, also watch for volatility caused by trading session switches; your plan should be based on price conditions—don’t let emotions replace execution.
The meaning of scaling in is not to keep averaging down, but to control the pace while the structure remains effective. Once key support becomes invalid, you should stop the original layout plan and wait for a new price range to form.
A trading plan must include invalidation conditions. If your judgment is correct, you can realize profits in stages. If your judgment is wrong, you must allow yourself to exit—you cannot use adding positions to cover the fact that the initial logic has changed. The market will update, and your viewpoint should adjust according to price evidence.
#QatarExtendsLNGForceMajeureByOneMonth