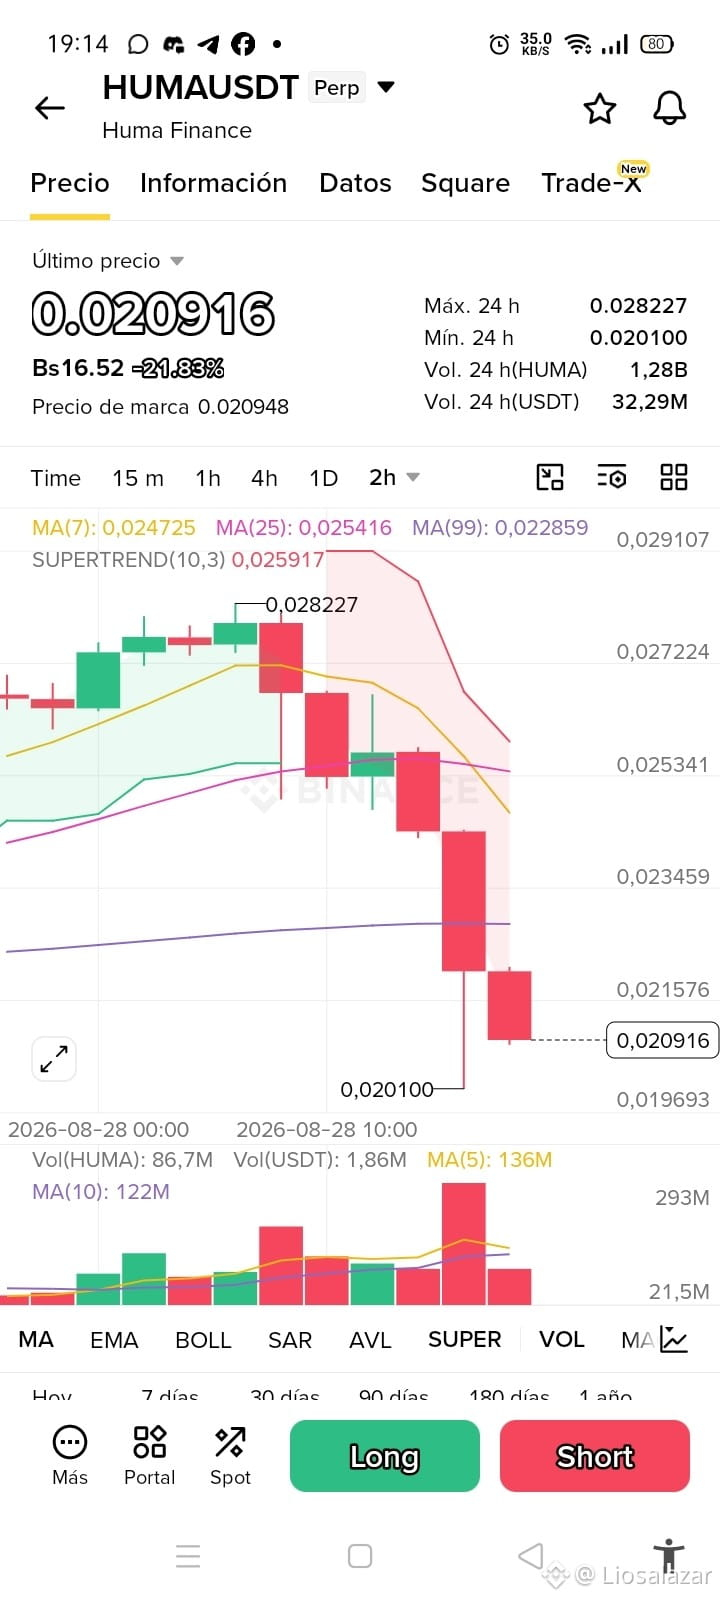
Technical Analysis: HUMAUSDT (Huma Finance - Perpetual Futures Market) on the 2-Hour timeframe (2h)
Analysis of the HUMAUSDT pair, which shows a significant drop of -21.83%, trading at 0.020916 USDT after losing key supports and marking a temporary floor at 0.020100 USDT.
Key market data:
Last price: 0.020916 USDT (-21.83%).
Mark price: 0.020948 USDT.
24h High: 0.028227 USDT.
24h Low: 0.020100 USDT.
24h Volume: 1.28B HUMA / 32.29M USDT.
Market: Perpetual Futures / Binance.
Technical levels and key indicators (2h):
Moving Averages:
MA(99): 0.022859 USDT (dynamic and immediate resistance).
MA(7): 0.024725 USDT (short-term resistance).
MA(25): 0.025416 USDT (intermediate resistance).
SuperTrend (10,3): Remains bearish (red), setting its main resistance at 0.025917 USDT.
Reference points:
Local resistance: Recent high at 0.028227 USDT.
Key defensive support: Base of the bearish impulse at 0.020100 USDT.
Outlook:
HUMAUSDT shows strong sell-side pressure on the 2-hour timeframe. After reaching a local high at 0.028227 USDT, the asset began a run of consecutive red candles with high selling volume, breaking down below the MA(99) (0.022859 USDT) and extending the correction down to 0.020100 USDT.
At this moment, the price is trying to stabilize near the 0.020900 USDT threshold. For buyers to attempt a rebound or technical relief structure, it will be crucial to recover the MA(99) zone (0.022859 USDT). As long as the price stays below the MA(7) (0.024725 USDT), the dominant trend will remain bearish. If the price loses the critical support at 0.020100 USDT, the way would open for further declines.
(Disclaimer: Structured informational content for Binance Square. This does not constitute financial or investment advice. Always do your own research.)
#HUMA #HumaFinance #Crypto #Futures #Trading #BinanceSquare #TechnicalAnalysis
Analysis of the HUMAUSDT pair, which shows a significant drop of -21.83%, trading at 0.020916 USDT after losing key supports and marking a temporary floor at 0.020100 USDT.
Key market data:
Last price: 0.020916 USDT (-21.83%).
Mark price: 0.020948 USDT.
24h High: 0.028227 USDT.
24h Low: 0.020100 USDT.
24h Volume: 1.28B HUMA / 32.29M USDT.
Market: Perpetual Futures / Binance.
Technical levels and key indicators (2h):
Moving Averages:
MA(99): 0.022859 USDT (dynamic and immediate resistance).
MA(7): 0.024725 USDT (short-term resistance).
MA(25): 0.025416 USDT (intermediate resistance).
SuperTrend (10,3): Remains bearish (red), setting its main resistance at 0.025917 USDT.
Reference points:
Local resistance: Recent high at 0.028227 USDT.
Key defensive support: Base of the bearish impulse at 0.020100 USDT.
Outlook:
HUMAUSDT shows strong sell-side pressure on the 2-hour timeframe. After reaching a local high at 0.028227 USDT, the asset began a run of consecutive red candles with high selling volume, breaking down below the MA(99) (0.022859 USDT) and extending the correction down to 0.020100 USDT.
At this moment, the price is trying to stabilize near the 0.020900 USDT threshold. For buyers to attempt a rebound or technical relief structure, it will be crucial to recover the MA(99) zone (0.022859 USDT). As long as the price stays below the MA(7) (0.024725 USDT), the dominant trend will remain bearish. If the price loses the critical support at 0.020100 USDT, the way would open for further declines.
(Disclaimer: Structured informational content for Binance Square. This does not constitute financial or investment advice. Always do your own research.)
#HUMA #HumaFinance #Crypto #Futures #Trading #BinanceSquare #TechnicalAnalysis