

Let’s analyze Bitcoin. It seems the market has started moving downward!
⌛️ One-hour time frame
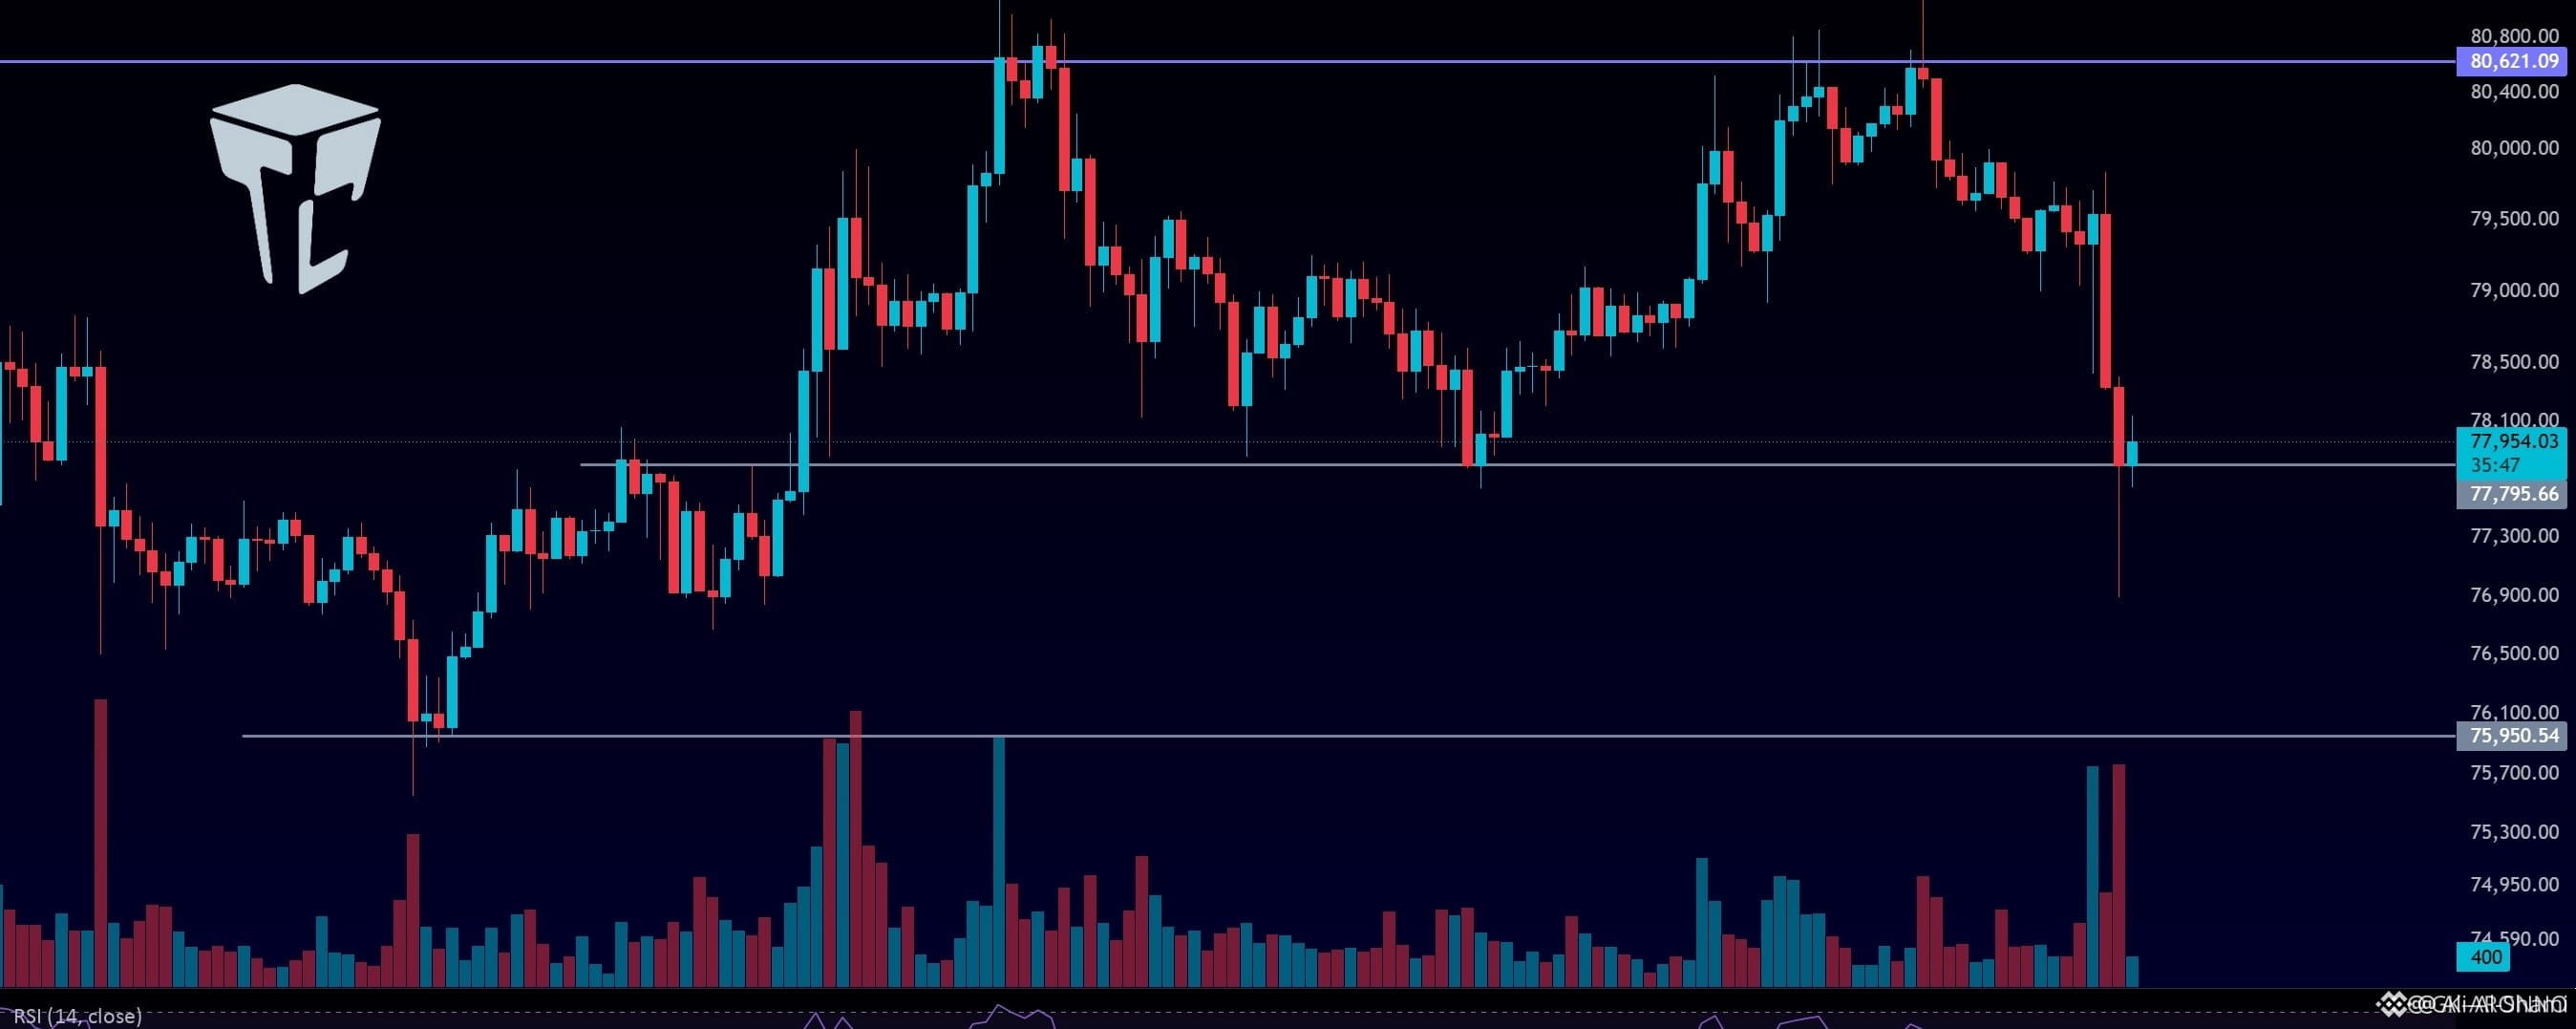
Yesterday, we had a long signal on Bitcoin at the level 80621. However, the price failed to stabilize above this area, and after a strong rejection from this level, it corrected deeper, reaching 77795.
📊 Sell volumes have increased significantly now, as the previous candle showed sell-offs; the price interacted with the level 77795.
✔️ If the price manages to consolidate below 77795, a deeper correction could occur toward 75950.
📊 If we want to trade the shorter cycles, we can open a short-term short scalp position after a breakout/breakdown occurs to the downside below 77795.
💥 The RSI indicator is also currently in the oversold zone. And since the overall trend is still upward, if it turns out that this RSI move was a false signal, new bullish momentum could enter the market.
❌ Alert ❌
High-risk and dangerous futures trading. If you’re not an expert, these signals may not be suitable for you. You should first learn risk management and capital management. You can also use the educational content from this channel.
Finally, these signals reflect my personal opinion about price movement, and the market may move entirely against these analyses. So, do your own research before opening any position.

#WarshSaysInflationIsFedTopFocus #SOLJumps20%OnTheWeek #CaliforniaBillWouldBarOfficialMemeCoins #$6.4BBitcoinOptionsExpire #TRONMainnetActivatesTVMPragueOsaka