$BTC
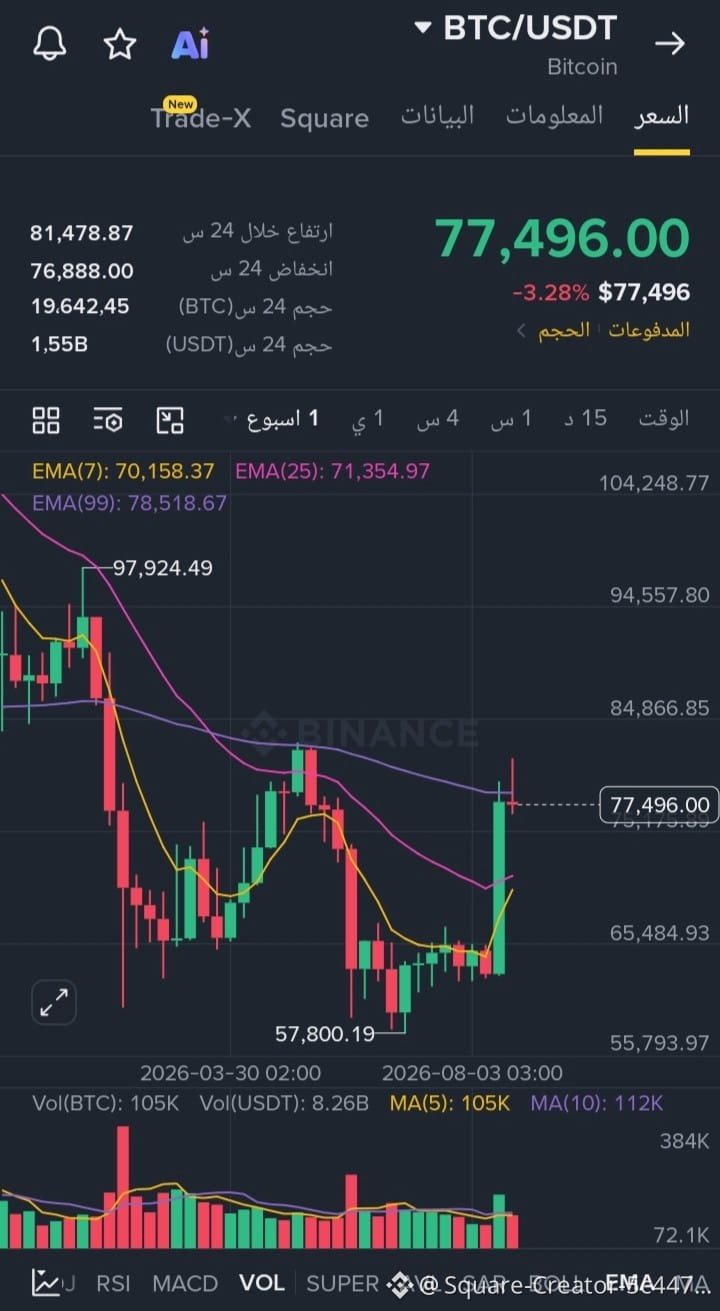
🟤 Market direction: The BTC/USDT pair is currently moving at the $77,496 level with a daily decline of 3.28%, after a strong bullish rebound from the low at $57,800.19.
🟣 Moving Averages (EMA): The fast moving averages show EMA(7) at 70,158 and EMA(25) at 71,354, indicating a positive short-term uptrend (bullish crossover). However, the price immediately hits resistance from the slow moving average EMA(99) at $78,518.67.
🔵 Support and Resistance Levels: The zone extending between $78,500 - $84,866 is considered a strong resistance area that must be broken to confirm the continuation of the uptrend toward $94,557. Meanwhile, the $71,350 - $70,150 level forms the closest major support area if the price pulls back.
🔴 Trading Volume: The chart shows a noticeable increase in trading volume (Vol = 105K) with the latest green candle, reflecting the entry of strong buying liquidity that contributed to the current rise before the price began to fluctuate around the current resistance levels.
#QatarExtendsLNGForceMajeureByOneMonth
🟤 Market direction: The BTC/USDT pair is currently moving at the $77,496 level with a daily decline of 3.28%, after a strong bullish rebound from the low at $57,800.19.
🟣 Moving Averages (EMA): The fast moving averages show EMA(7) at 70,158 and EMA(25) at 71,354, indicating a positive short-term uptrend (bullish crossover). However, the price immediately hits resistance from the slow moving average EMA(99) at $78,518.67.
🔵 Support and Resistance Levels: The zone extending between $78,500 - $84,866 is considered a strong resistance area that must be broken to confirm the continuation of the uptrend toward $94,557. Meanwhile, the $71,350 - $70,150 level forms the closest major support area if the price pulls back.
🔴 Trading Volume: The chart shows a noticeable increase in trading volume (Vol = 105K) with the latest green candle, reflecting the entry of strong buying liquidity that contributed to the current rise before the price began to fluctuate around the current resistance levels.
#QatarExtendsLNGForceMajeureByOneMonth