😱😨😨😱تُـــــــنـــــــٌبّـــــــيـــــــّهِ🟩 هِآمِــــــــ عــــــــلَى عــــــــمِــــــــلَة $BTC 〽️〽️🔥💹
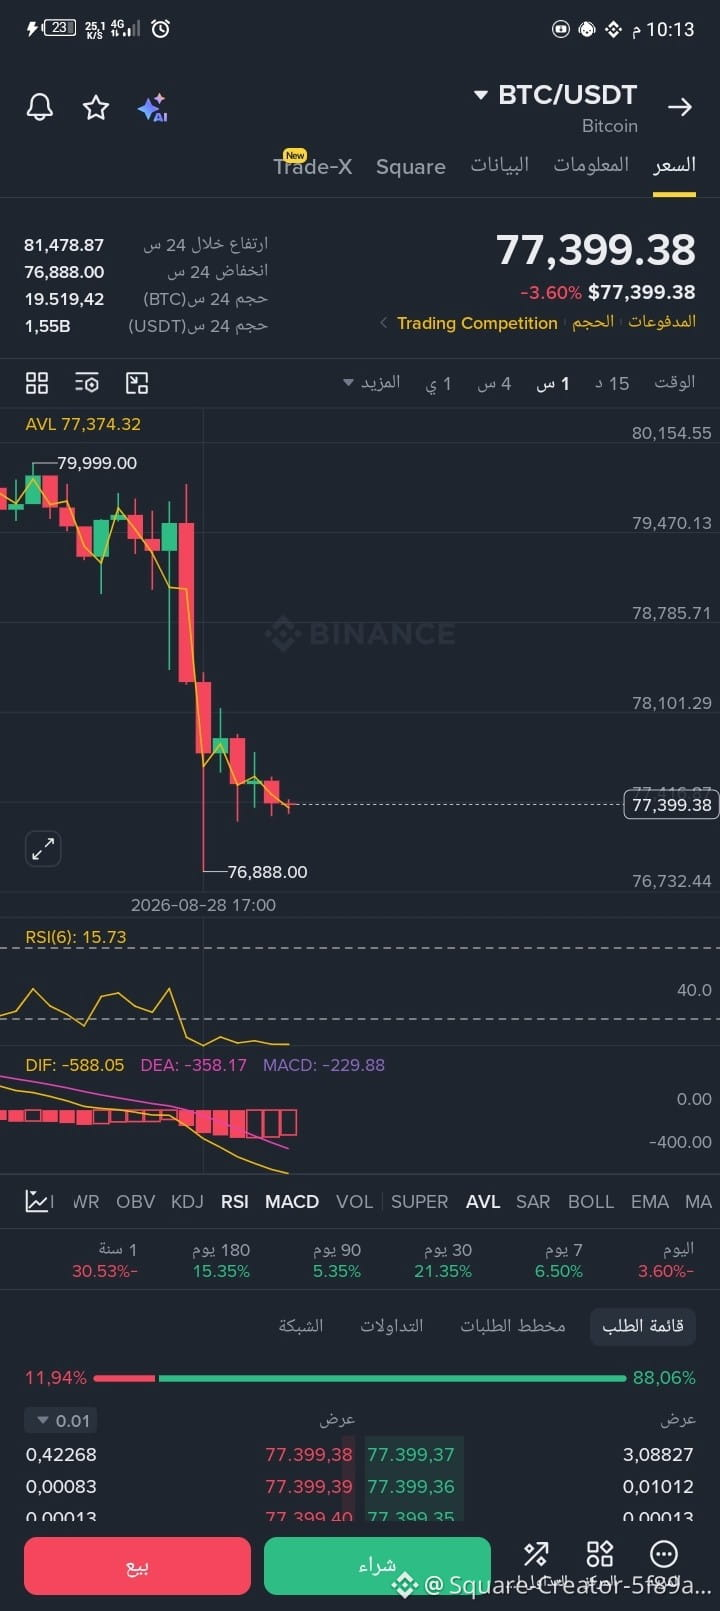
Price Action: The price saw a sharp and clear drop from the 80,000$ level down to the local low at 76,888$. This was followed by stabilization and weak sideways oscillation near the lower levels, indicating strong control by selling forces (Bearish Momentum).
Relative Strength Index (RSI 6): It records 15.73, which is an extremely low level indicating that the price has entered a state of severe sell-side exhaustion (Oversold). Typically, these levels are followed by short trading bounces (Bounce) to rebalance the indicator.
$MAC.US indicator: It is located in the negative zone, with the expansion of the white/pink liquidity columns for the downward move (DIF: -588.05 / DEA: -358.17), reflecting the continuation of negative momentum up to this moment.
Support and Resistance Levels
First Support (Current Low): 76,888.00$ — Holding above it is essential to prevent further price slippage.
First Resistance: 78,100$ — The first level the price needs to break in order to restore balance on the short timeframes.
Main Resistance: 79,470$- 80,000$ — The prior breakout area and the higher accumulation zone.
Price Action: The price saw a sharp and clear drop from the 80,000$ level down to the local low at 76,888$. This was followed by stabilization and weak sideways oscillation near the lower levels, indicating strong control by selling forces (Bearish Momentum).
Relative Strength Index (RSI 6): It records 15.73, which is an extremely low level indicating that the price has entered a state of severe sell-side exhaustion (Oversold). Typically, these levels are followed by short trading bounces (Bounce) to rebalance the indicator.
$MAC.US indicator: It is located in the negative zone, with the expansion of the white/pink liquidity columns for the downward move (DIF: -588.05 / DEA: -358.17), reflecting the continuation of negative momentum up to this moment.
Support and Resistance Levels
First Support (Current Low): 76,888.00$ — Holding above it is essential to prevent further price slippage.
First Resistance: 78,100$ — The first level the price needs to break in order to restore balance on the short timeframes.
Main Resistance: 79,470$- 80,000$ — The prior breakout area and the higher accumulation zone.