Trading Thesis|8/29 05:21
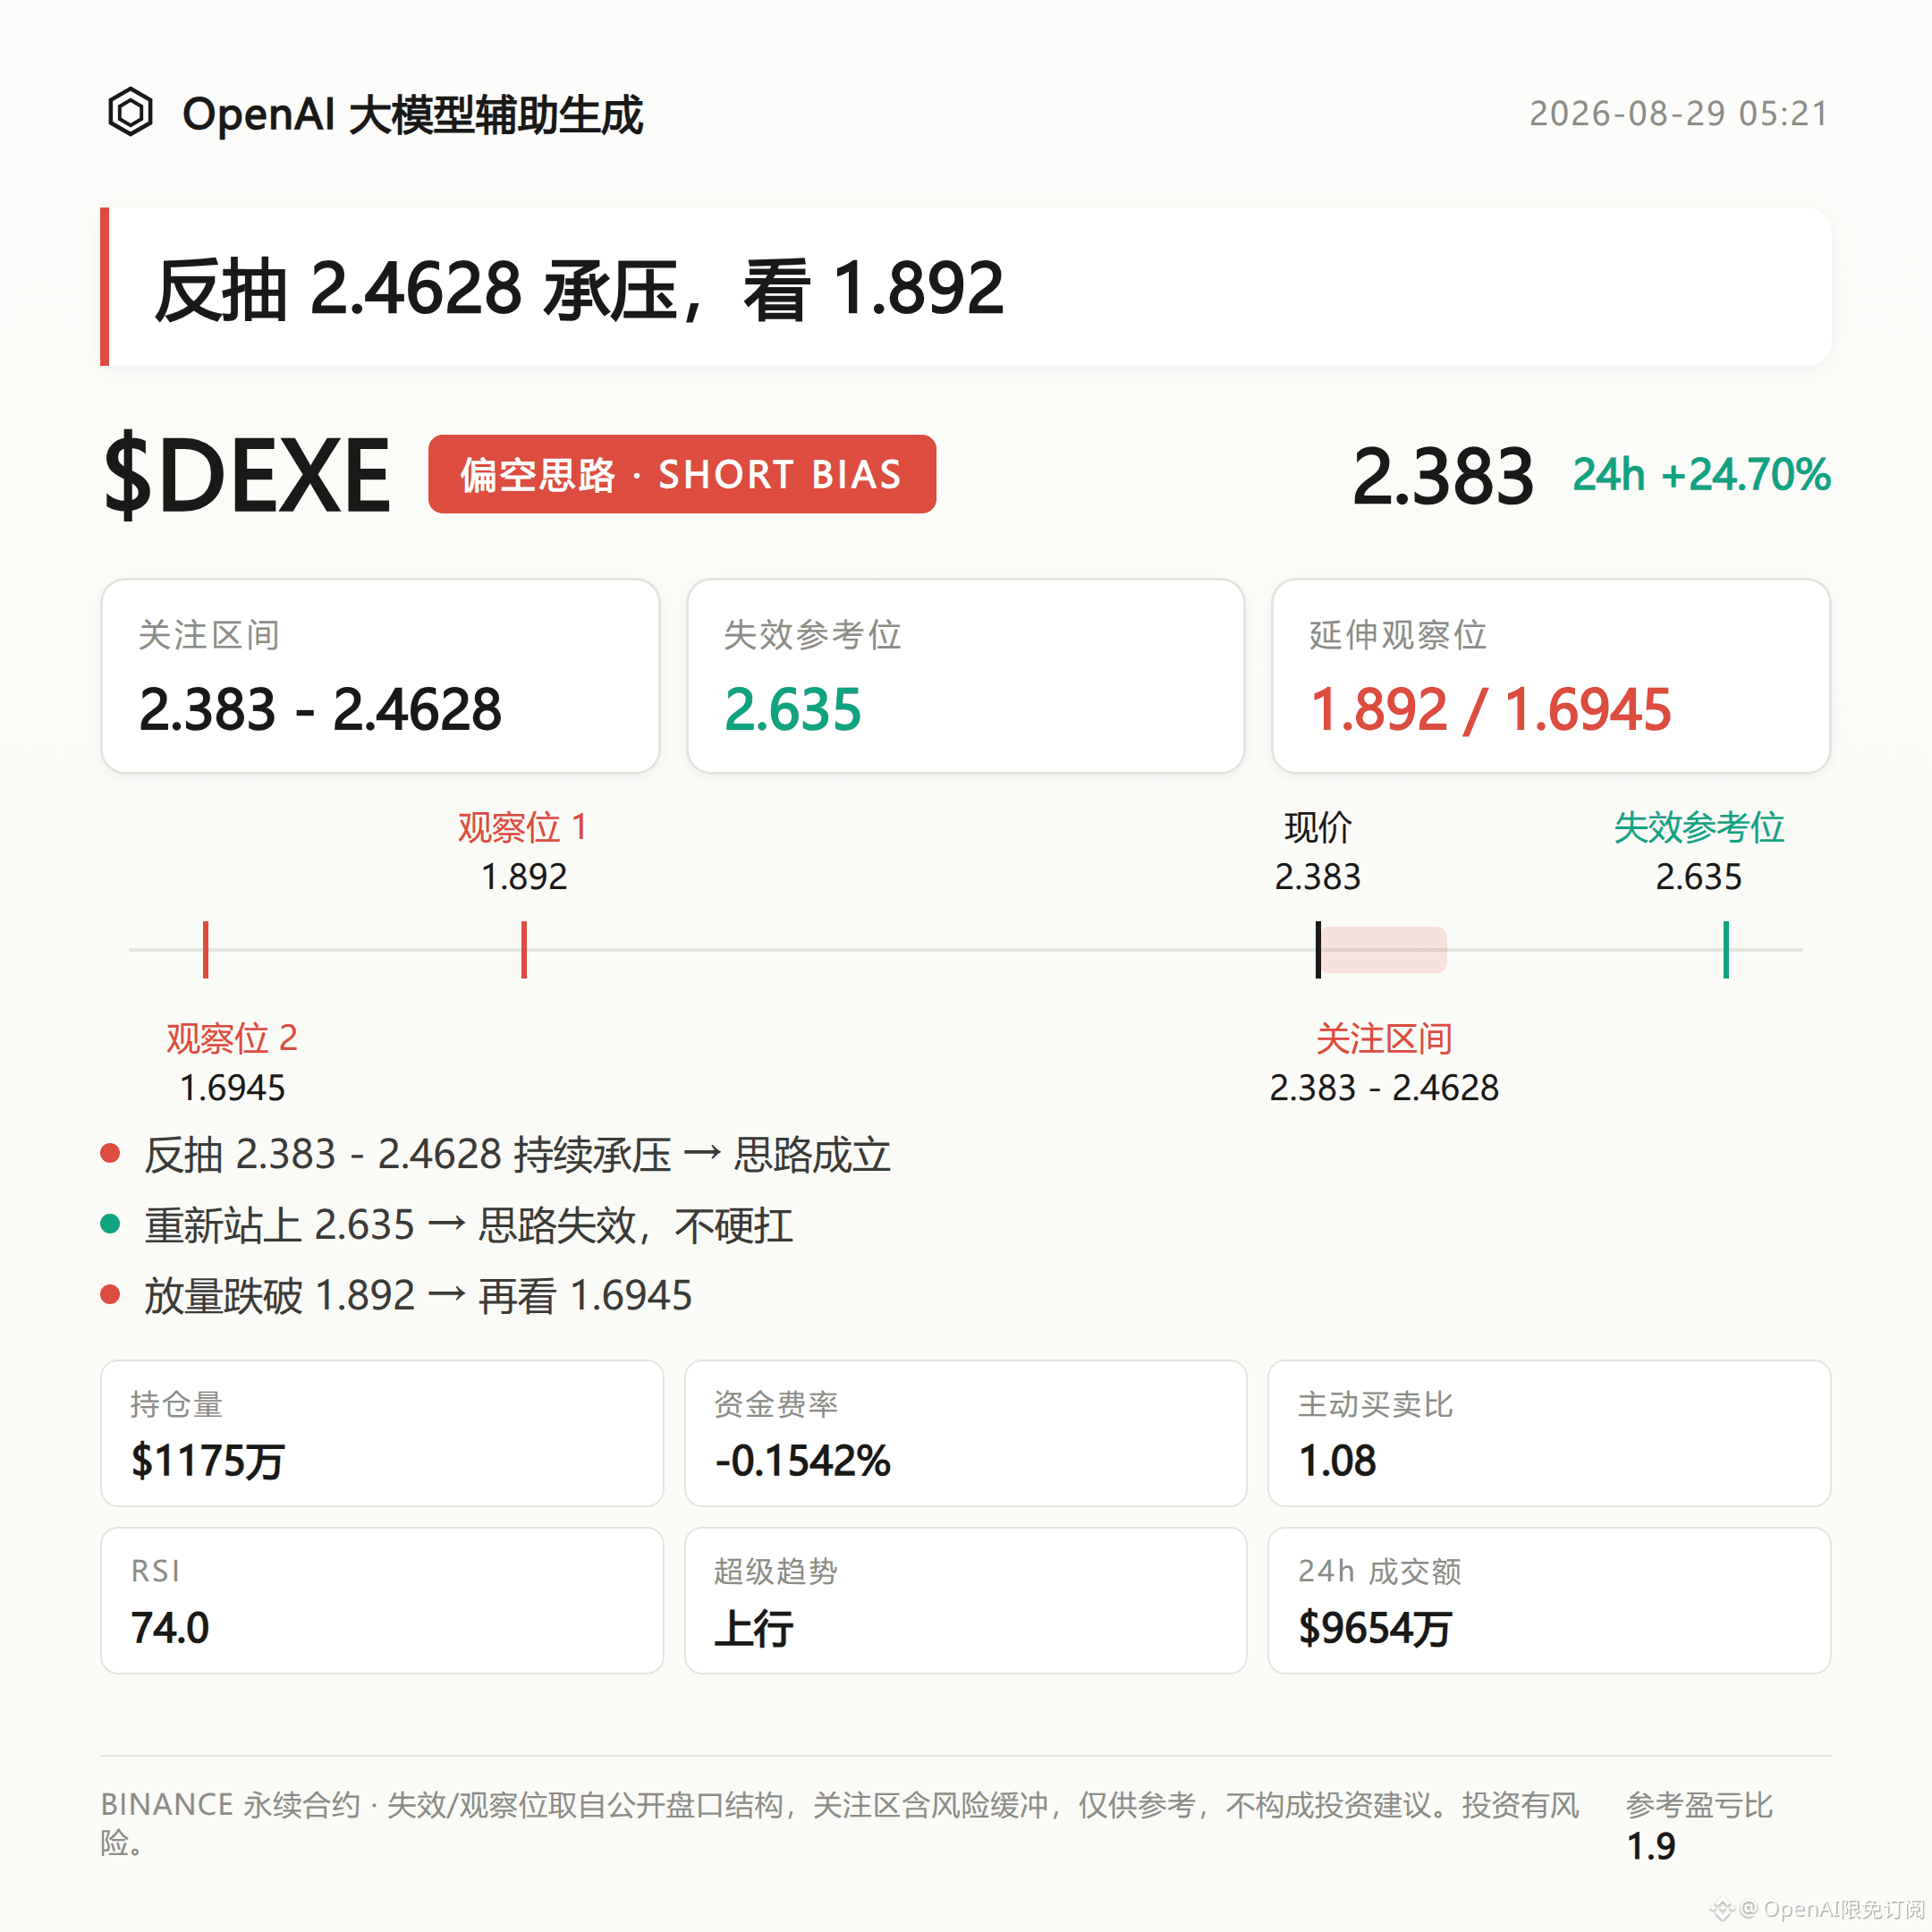
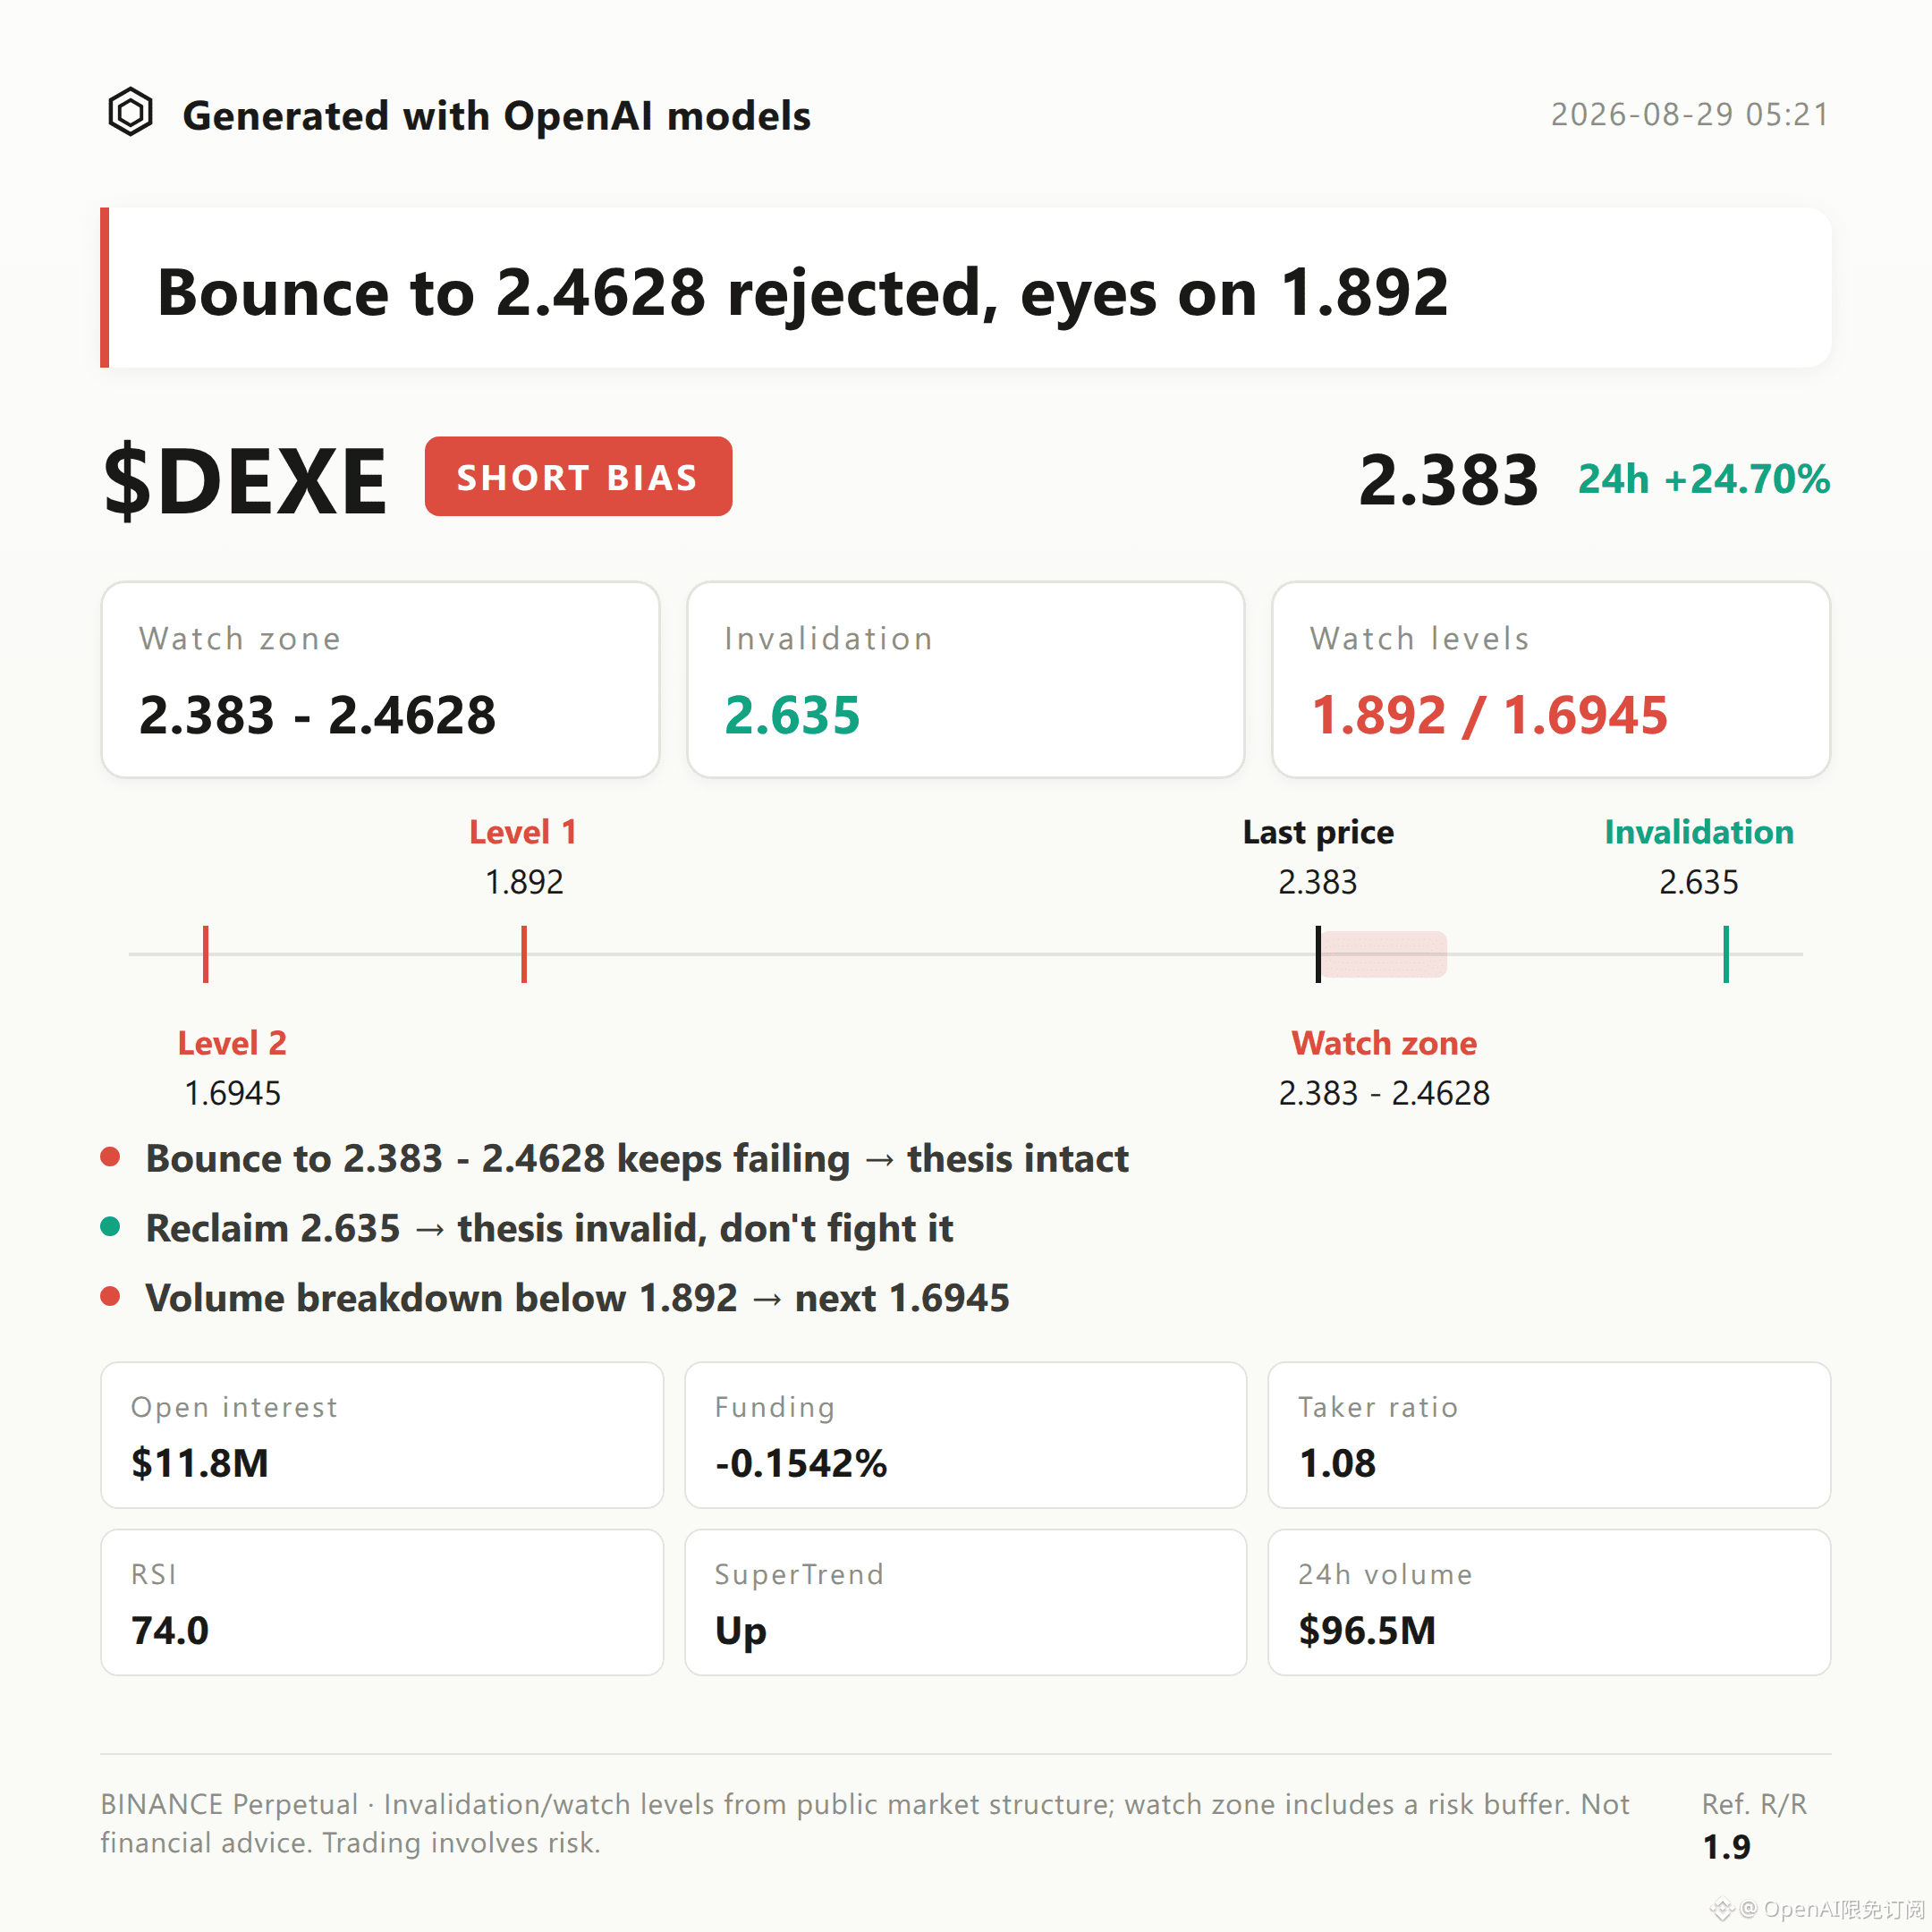
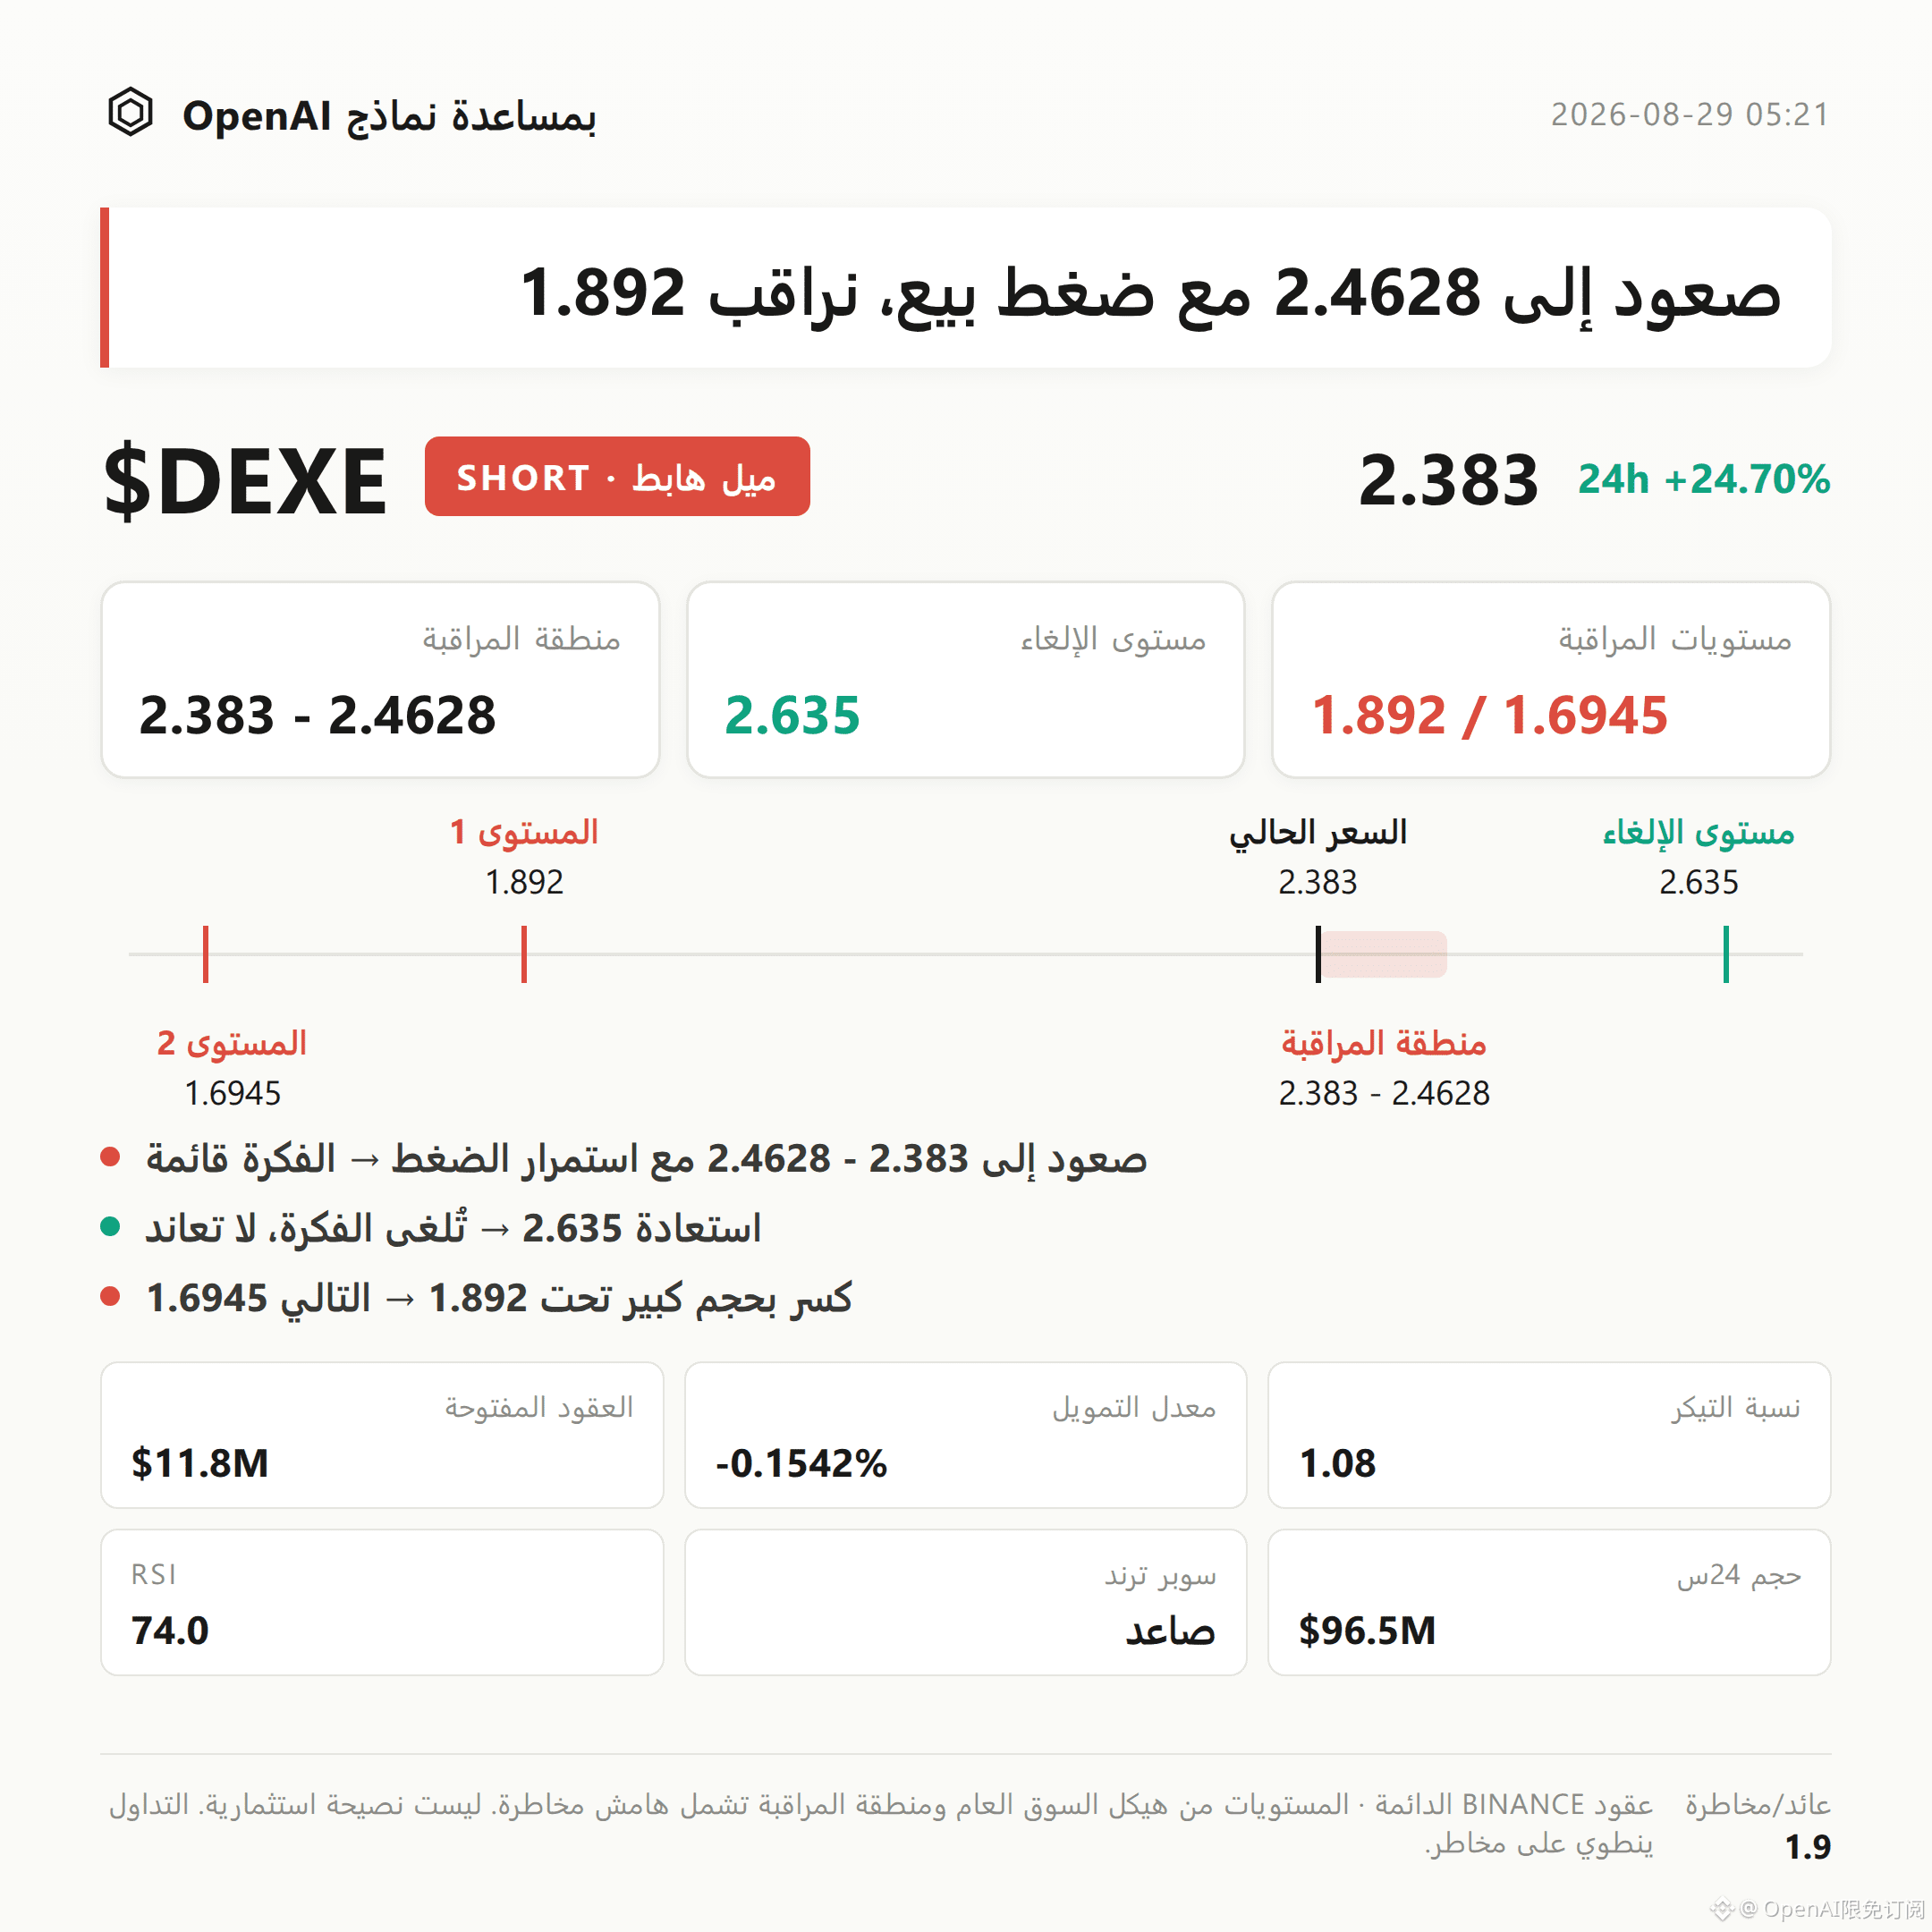
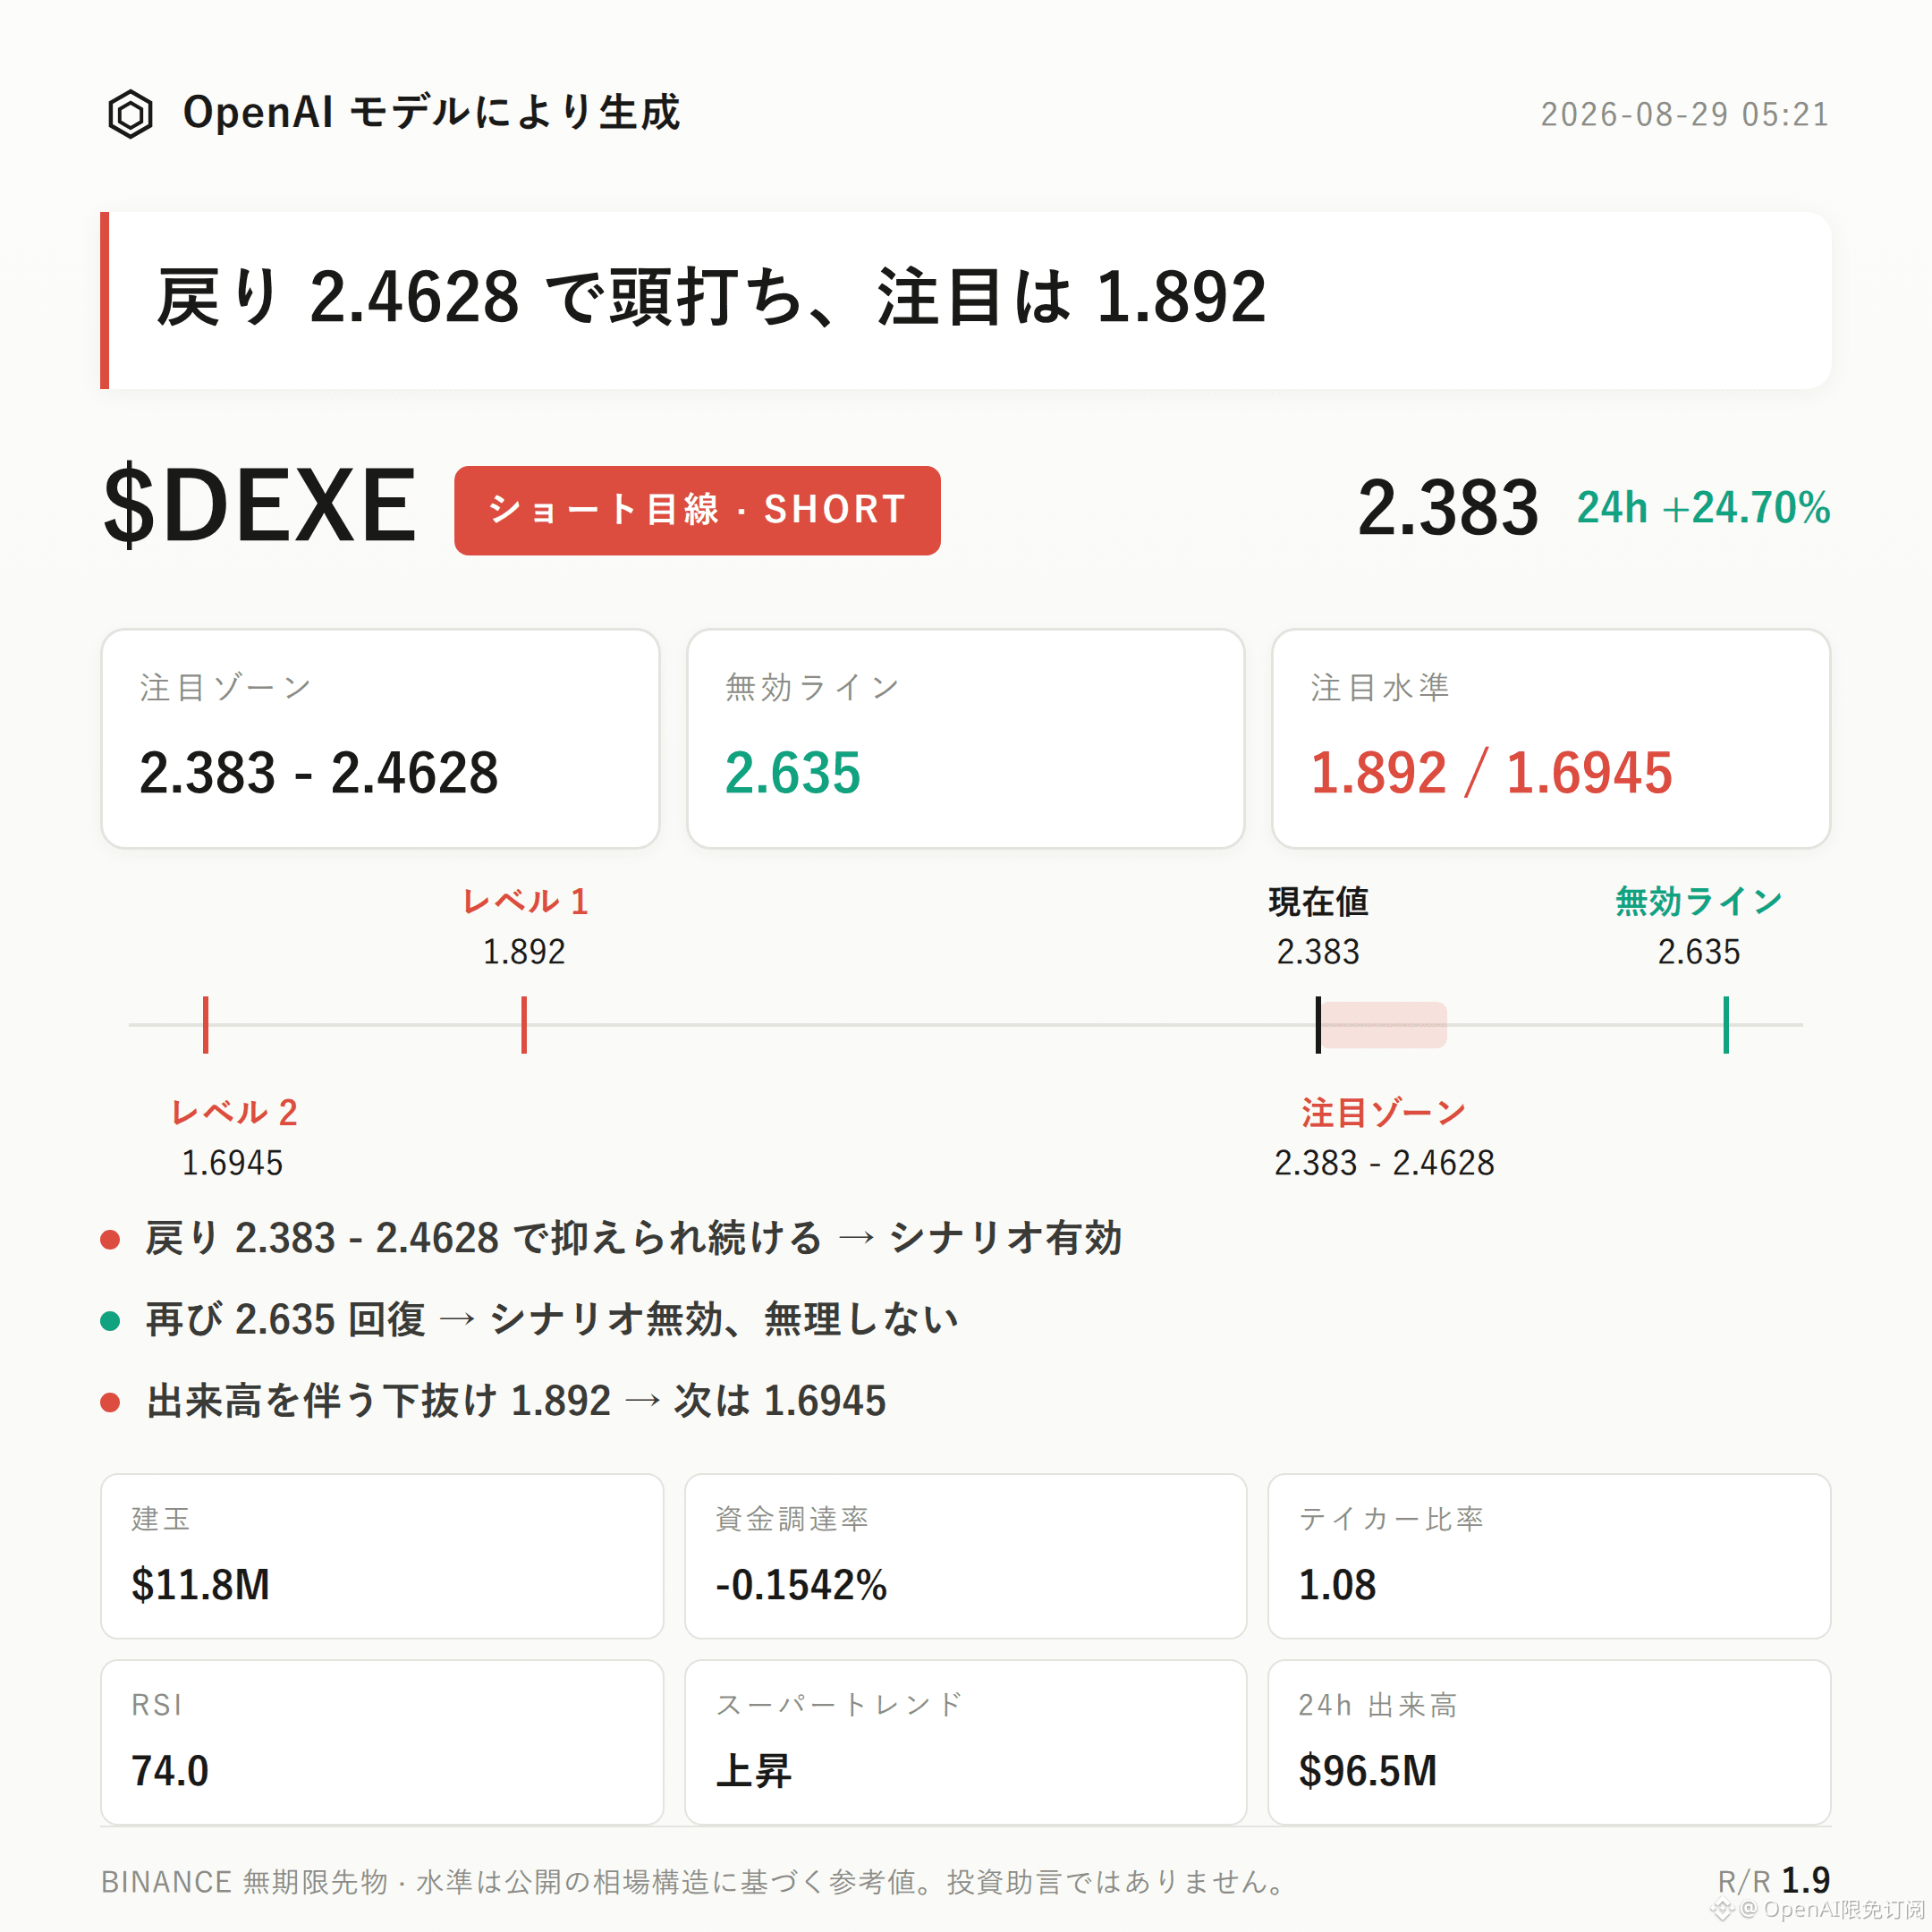
$DEXE Bearish-leaning thesis | Watch zone 2.383 - 2.4628 | Invalidation reference 2.635 | Observation levels 1.892 / 1.6945
The current $DEXE bearish-leaning thesis is in the process of forming.
The core arguments come from three points: the funding rate has turned negative and shorts are paying a premium to longs; during a 24-hour surge of +24.70%, open interest jumped by 40.2%, indicating a clear rise in short-term crowding; RSI has reached the overbought zone at 74.0, and the risk of a pullback is building.
For validation, look to see whether the retest within 2.383-2.4628 can be suppressed— the more clearly it gets suppressed, the higher the thesis’s validity.
From a technical structure perspective, price has already touched the upper Bollinger Band around 2.4628. The mid-band is at 2.0787 and the lower band at 1.6945. After a volume-backed surge, momentum near the upper band can easily start to fade at the margin.
The recent high is 2.635, the recent low is 1.892, and the current price at 2.383 is in the upper part of the range; the prior high has not yet been effectively broken.
To state plainly: the Supertrend indicator still shows upward direction, and the MACD maintains bullish momentum— the primary trend direction has not turned bearish. This thesis is more about a pullback structure after being overbought at higher levels, not a trend-reversal call.
On the derivatives side, in the past 24 hours the trading volume was $96.54 million, open interest was $11.75 million, and it increased by 40.2% over 24 hours. The synchronous expansion of volume and positions suggests that chase-buying capital is concentrating in.
The funding rate is -0.1542%; that means shorts are paying funding to longs, indicating shorts are relatively crowded. Long accounts make up 64%, showing the account composition is also long-leaning.
The buy/sell ratio for active trading is 1.08—buy orders have a slight advantage. In the short term, sentiment remains relatively optimistic, which offsets the overbought pullback thesis; we need to watch whether sentiment can cool down.
The reference path can be viewed in three segments.
If price retests up to the 2.383-2.4628 watch zone and then shows signs of stalled upward movement or pressure pulling back, the confirmation of the bearish structure increases.
If price reclaims 2.635, it means the current pullback structure is broken— the bearish thesis would be invalid and should not be applied further.
If the downside 1.892 breaks with volume, you can continue monitoring whether support near 1.6945 can absorb price; do not make further downward-extension assumptions before the break.
The reference risk-reward ratio is 1.9.
Key reverse evidence that must be disclosed: the funding rate has already turned negative, and shorts are crowded. Once the rebound strength exceeds expectations, it can easily turn into a squeeze-style rally.
Meanwhile, the active buy/sell ratio is 1.08, the Supertrend is rising, and MACD bullish momentum all point to the primary trend not yet turning bearish. This post is only observing the stage-by-stage structure after being overbought at higher levels; it does not represent a trend-reversal judgment.
Under contract leverage, position discipline is more important than directional judgment.
Also attached: In the live account, $FOGO long positions are still being held; personally, I remain bullish on the medium-term structure.
For reference only and does not constitute investment advice. Leverage applies to contracts; investing involves risk.
This article was generated with assistance from an OpenAI model.
$DEXE
#Contract Analysis
$DEXE Bearish-leaning thesis | Watch zone 2.383 - 2.4628 | Invalidation reference 2.635 | Observation levels 1.892 / 1.6945
The current $DEXE bearish-leaning thesis is in the process of forming.
The core arguments come from three points: the funding rate has turned negative and shorts are paying a premium to longs; during a 24-hour surge of +24.70%, open interest jumped by 40.2%, indicating a clear rise in short-term crowding; RSI has reached the overbought zone at 74.0, and the risk of a pullback is building.
For validation, look to see whether the retest within 2.383-2.4628 can be suppressed— the more clearly it gets suppressed, the higher the thesis’s validity.
From a technical structure perspective, price has already touched the upper Bollinger Band around 2.4628. The mid-band is at 2.0787 and the lower band at 1.6945. After a volume-backed surge, momentum near the upper band can easily start to fade at the margin.
The recent high is 2.635, the recent low is 1.892, and the current price at 2.383 is in the upper part of the range; the prior high has not yet been effectively broken.
To state plainly: the Supertrend indicator still shows upward direction, and the MACD maintains bullish momentum— the primary trend direction has not turned bearish. This thesis is more about a pullback structure after being overbought at higher levels, not a trend-reversal call.
On the derivatives side, in the past 24 hours the trading volume was $96.54 million, open interest was $11.75 million, and it increased by 40.2% over 24 hours. The synchronous expansion of volume and positions suggests that chase-buying capital is concentrating in.
The funding rate is -0.1542%; that means shorts are paying funding to longs, indicating shorts are relatively crowded. Long accounts make up 64%, showing the account composition is also long-leaning.
The buy/sell ratio for active trading is 1.08—buy orders have a slight advantage. In the short term, sentiment remains relatively optimistic, which offsets the overbought pullback thesis; we need to watch whether sentiment can cool down.
The reference path can be viewed in three segments.
If price retests up to the 2.383-2.4628 watch zone and then shows signs of stalled upward movement or pressure pulling back, the confirmation of the bearish structure increases.
If price reclaims 2.635, it means the current pullback structure is broken— the bearish thesis would be invalid and should not be applied further.
If the downside 1.892 breaks with volume, you can continue monitoring whether support near 1.6945 can absorb price; do not make further downward-extension assumptions before the break.
The reference risk-reward ratio is 1.9.
Key reverse evidence that must be disclosed: the funding rate has already turned negative, and shorts are crowded. Once the rebound strength exceeds expectations, it can easily turn into a squeeze-style rally.
Meanwhile, the active buy/sell ratio is 1.08, the Supertrend is rising, and MACD bullish momentum all point to the primary trend not yet turning bearish. This post is only observing the stage-by-stage structure after being overbought at higher levels; it does not represent a trend-reversal judgment.
Under contract leverage, position discipline is more important than directional judgment.
Also attached: In the live account, $FOGO long positions are still being held; personally, I remain bullish on the medium-term structure.
For reference only and does not constitute investment advice. Leverage applies to contracts; investing involves risk.
This article was generated with assistance from an OpenAI model.
$DEXE
#Contract Analysis