# $XRP Technical Review: Key Decisions Under Long-Short Tug of War
Everyone, when trading, you should speak with data and structure—not guess tops and bottoms based on emotions. Today, from a rigorous technical perspective, we’ll deeply dissect the market logic of $XRP .
From the perspective of multi-timeframe nesting, the current market shows a typical case of period resonance divergence: on the weekly timeframe, the moving average system remains in a bearish configuration, suppressing the upside room for medium- to long-term rebounds; on the daily timeframe, it’s in a standard uptrend channel, with moving averages dispersing upward (bullish divergence). However, on the 4-hour timeframe, there’s a clear contraction-and-pullback: volume decreases, the MACD momentum histogram shrinks, indicating that near-term bullish momentum has begun to wane.
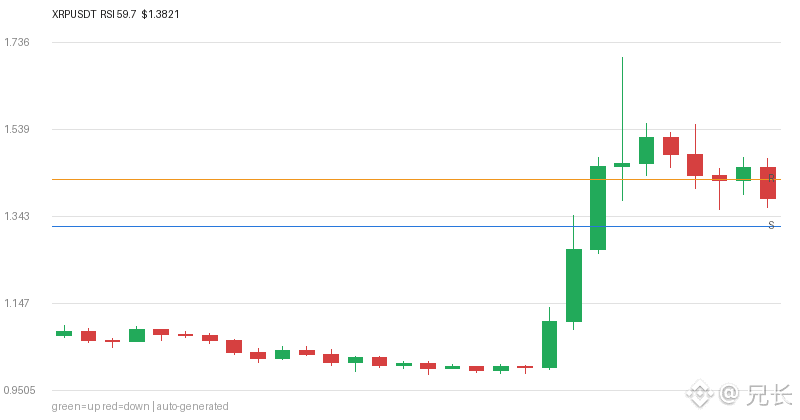
Even so, the main direction still favors a bullish mindset. The core logic is that price continues to stay above a key support level. As long as 1.3193—the previous period’s dense position zone—is not effectively broken down, the bullish structure on the daily timeframe has not been damaged; pullbacks are opportunities to build momentum.
Based on Fibonacci retracement and the relationship between price and volume, the trading plan is as follows:
- **Key Support**: 1.3193
- **Trade Direction**: Buy on dips
- **Rebound Target**: 1.4101
- **Hard Stop Loss**: 1.3325
Trading is a game of probabilities, and executing discipline always outperforms trying to predict direction.
What’s your current average entry price? Post your orders in the comments—let me see how many people are going against the trend to place trades.
$XRP
Everyone, when trading, you should speak with data and structure—not guess tops and bottoms based on emotions. Today, from a rigorous technical perspective, we’ll deeply dissect the market logic of $XRP .
From the perspective of multi-timeframe nesting, the current market shows a typical case of period resonance divergence: on the weekly timeframe, the moving average system remains in a bearish configuration, suppressing the upside room for medium- to long-term rebounds; on the daily timeframe, it’s in a standard uptrend channel, with moving averages dispersing upward (bullish divergence). However, on the 4-hour timeframe, there’s a clear contraction-and-pullback: volume decreases, the MACD momentum histogram shrinks, indicating that near-term bullish momentum has begun to wane.
Even so, the main direction still favors a bullish mindset. The core logic is that price continues to stay above a key support level. As long as 1.3193—the previous period’s dense position zone—is not effectively broken down, the bullish structure on the daily timeframe has not been damaged; pullbacks are opportunities to build momentum.
Based on Fibonacci retracement and the relationship between price and volume, the trading plan is as follows:
- **Key Support**: 1.3193
- **Trade Direction**: Buy on dips
- **Rebound Target**: 1.4101
- **Hard Stop Loss**: 1.3325
Trading is a game of probabilities, and executing discipline always outperforms trying to predict direction.
What’s your current average entry price? Post your orders in the comments—let me see how many people are going against the trend to place trades.
$XRP