$ONG It drops 14% but the volume tells a different story... Are we facing a liquidity trap? 📉
The display and data:
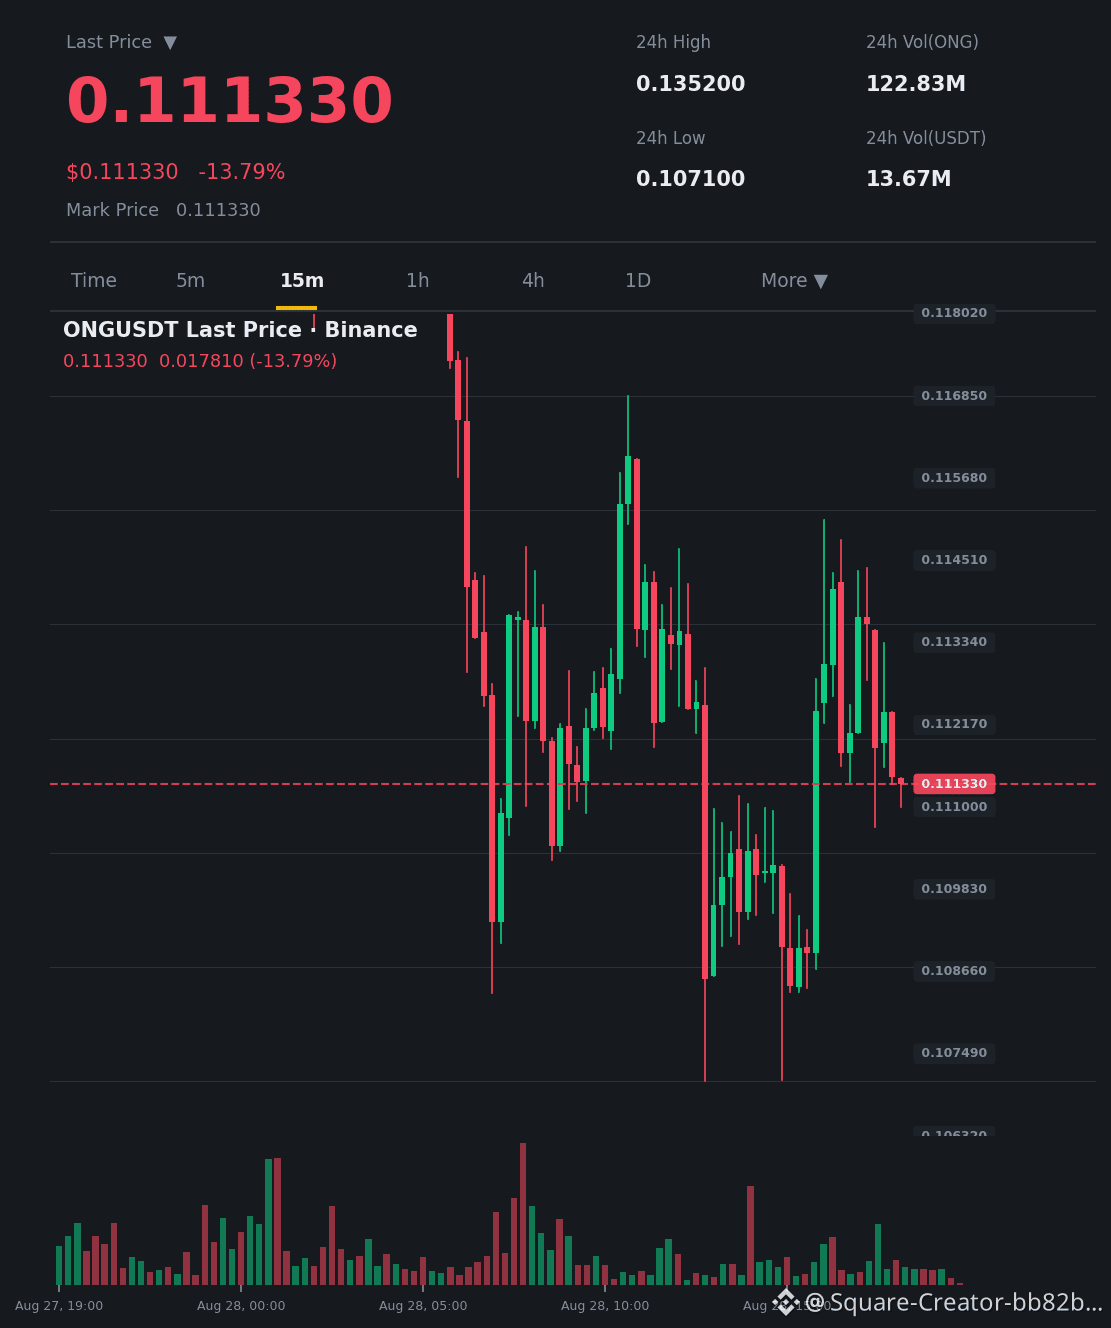
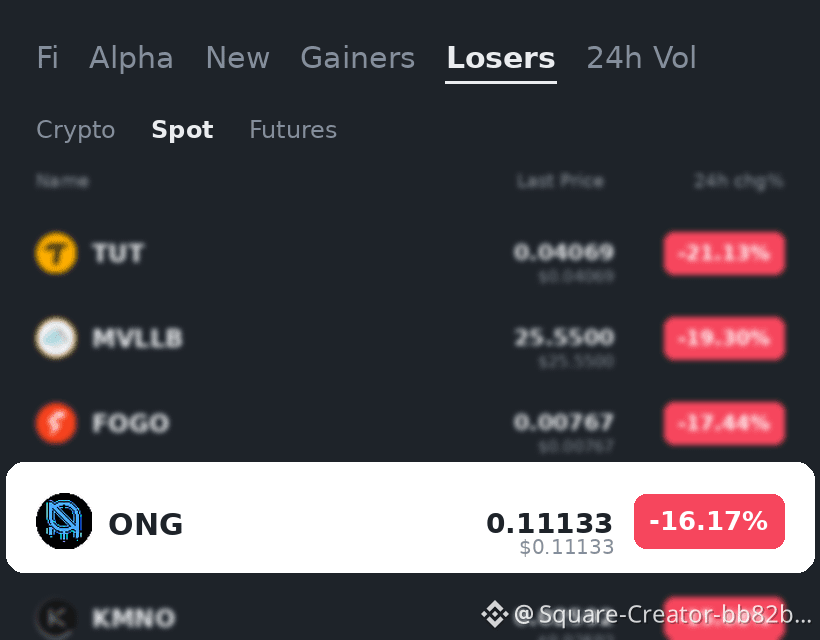
The price fell to 0.11133 with a 24-hour change of -14.42%, but the volume ratio of 0.07 reveals an almost complete absence of participants. The 15-minute chart shows falling candles with weak selling pressure, while the RSI indicator entered the oversold zone without volume confirmation. Liquidity is concentrated below the current levels, making drift easy.
Scenarios:
Positive: A return of volume above average at these prices suggests absorption of supply and an opportunity for a technical correction toward the session VWAP.
Negative: If volume remains dry, the price may break previous lows in search of liquidity, with no sustained bounce.
Conclusion:
The deciding factor is volume returning to confirm any real reversal. 🔑
Do you see this drop as an accumulation opportunity, or the start of an extended bearish trend? 🧐
$ONG
This content is not investment advice; do your own research (DYOR)
The display and data:
The price fell to 0.11133 with a 24-hour change of -14.42%, but the volume ratio of 0.07 reveals an almost complete absence of participants. The 15-minute chart shows falling candles with weak selling pressure, while the RSI indicator entered the oversold zone without volume confirmation. Liquidity is concentrated below the current levels, making drift easy.
Scenarios:
Positive: A return of volume above average at these prices suggests absorption of supply and an opportunity for a technical correction toward the session VWAP.
Negative: If volume remains dry, the price may break previous lows in search of liquidity, with no sustained bounce.
Conclusion:
The deciding factor is volume returning to confirm any real reversal. 🔑
Do you see this drop as an accumulation opportunity, or the start of an extended bearish trend? 🧐
$ONG
This content is not investment advice; do your own research (DYOR)