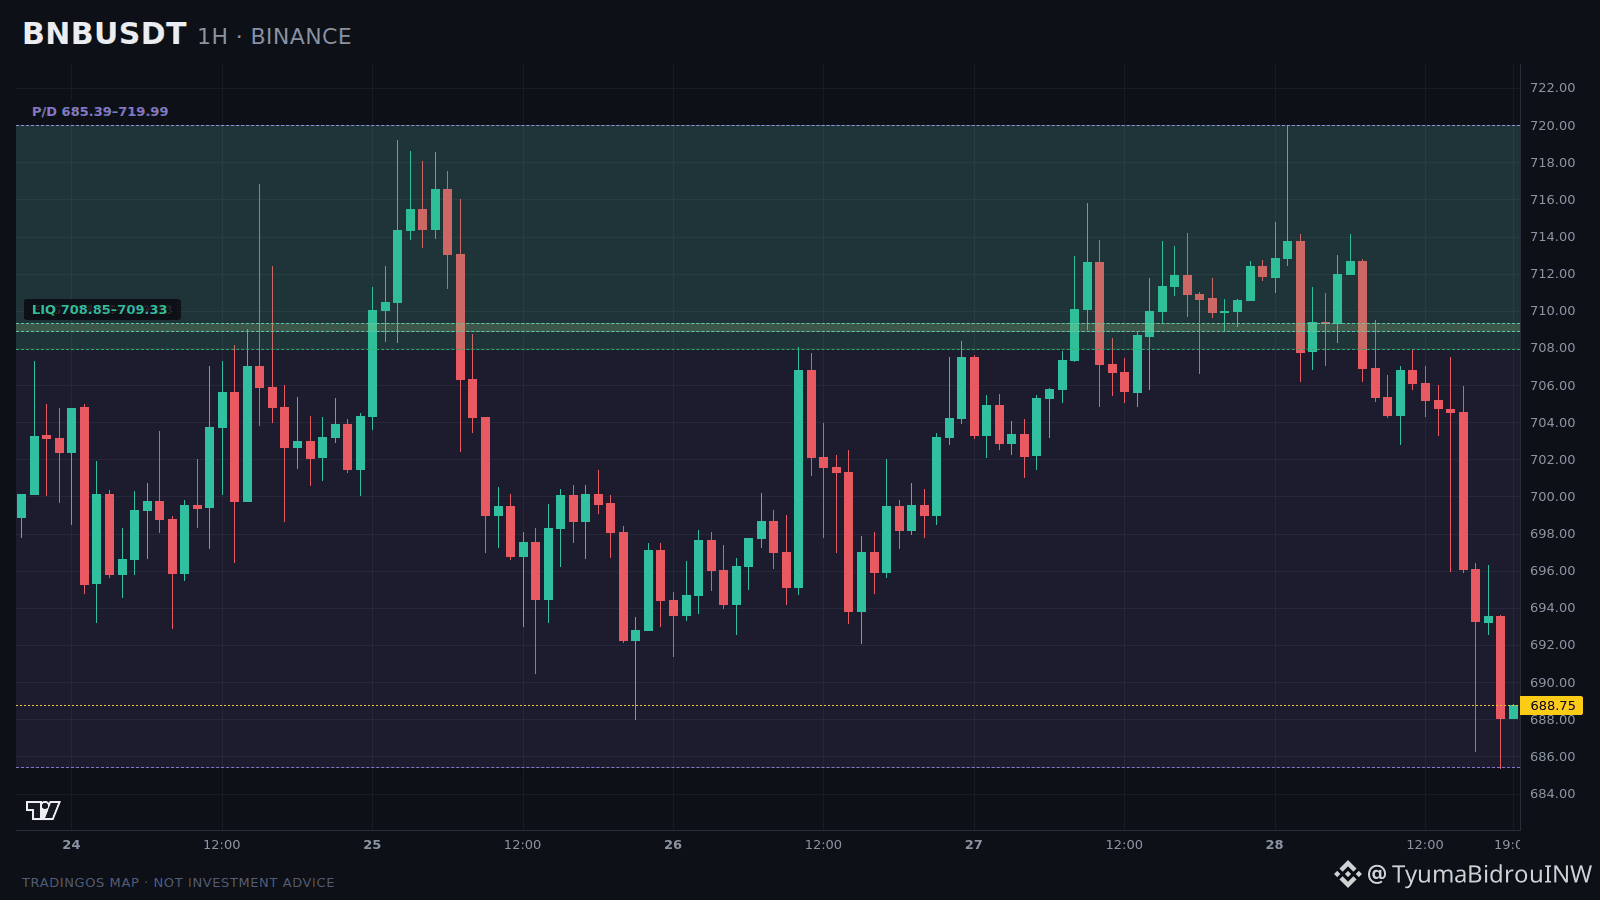
Around $BNB there is a lot of noise, but one zone determines everything — it’s above the current price.
Price is about 688.74, per day -3.131%.
Daily range: 685.39-719.99.
What you can see on TradingOS:
— Above the current price there is a POI 707.88-719.99 — a pressure zone, not support, because the price is currently below it;
— Above the current price there is a bullish FVG 710.66-711.66 — a pressure zone, not support, because the price is currently below it;
— Above the current price there is a bearish FVG 711.27-712.47 — a pressure zone, not support, because the price is currently below it;
— Above the current price there is a bullish OB zone 705.07-707.44 — a pressure zone, not support, because the price is currently below it;
Weights of scenarios based on current data:
Long scenario — 8%;
Short scenario — 77%.
This is not the probability of a trade, but an estimate of the context.
What matters:
If the price returns above the 710.66-711.66 area and holds there, the long context will start to strengthen. If the reaction is again weak, the bearish scenario will remain the main one.
This is a scenario map, not a trading instruction.
$BNB #Crypto #BinanceSquare #Trading
Chart and order book — click on $BNB .
Not an investment recommendation.
Which coin should be analyzed next? Drop the ticker in the comments.
Real-time analyses and a full log — on X: @TyumaBidrouINW
Price is about 688.74, per day -3.131%.
Daily range: 685.39-719.99.
What you can see on TradingOS:
— Above the current price there is a POI 707.88-719.99 — a pressure zone, not support, because the price is currently below it;
— Above the current price there is a bullish FVG 710.66-711.66 — a pressure zone, not support, because the price is currently below it;
— Above the current price there is a bearish FVG 711.27-712.47 — a pressure zone, not support, because the price is currently below it;
— Above the current price there is a bullish OB zone 705.07-707.44 — a pressure zone, not support, because the price is currently below it;
Weights of scenarios based on current data:
Long scenario — 8%;
Short scenario — 77%.
This is not the probability of a trade, but an estimate of the context.
What matters:
If the price returns above the 710.66-711.66 area and holds there, the long context will start to strengthen. If the reaction is again weak, the bearish scenario will remain the main one.
This is a scenario map, not a trading instruction.
$BNB #Crypto #BinanceSquare #Trading
Chart and order book — click on $BNB .
Not an investment recommendation.
Which coin should be analyzed next? Drop the ticker in the comments.
Real-time analyses and a full log — on X: @TyumaBidrouINW