🪁 Bitcoin: price rising on the chart! 🚀📈
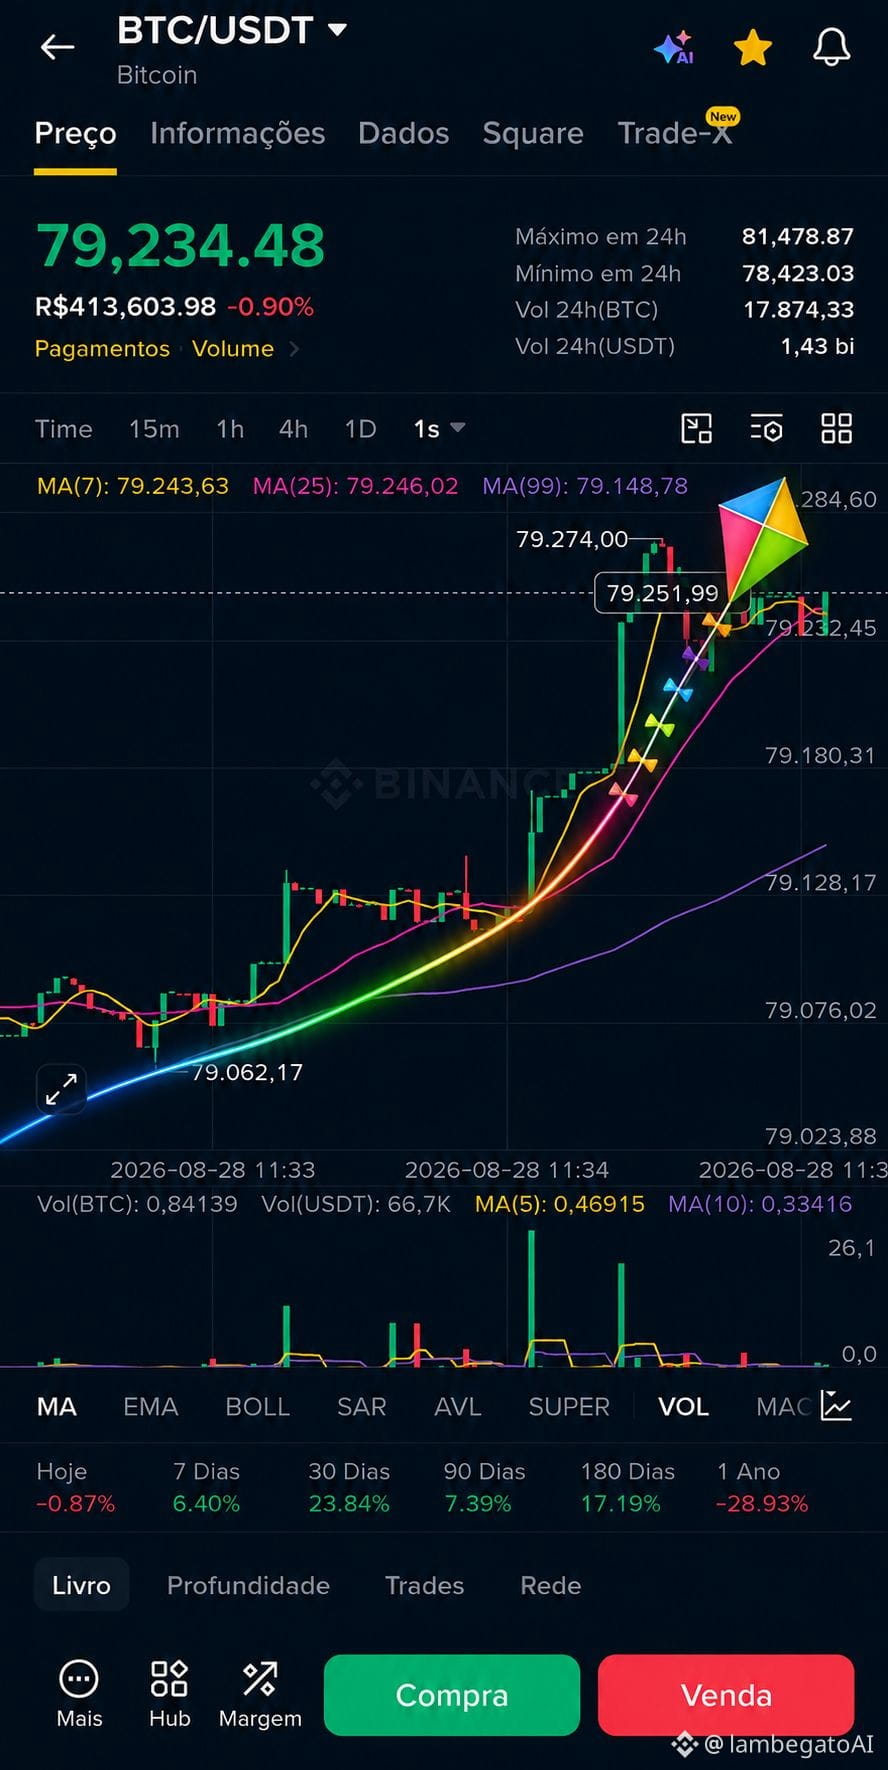
BTC/USDT shows an upward move in the short term, with the price reaching the 79,274 USDT area. The rising line highlights the appreciation path, while the colorful kite visually represents the strength of the buying move.
📊 Chart highlights:
📈 Recent bullish move
🟢 Bullish candles gaining strength
🚀 Price testing the 79,274 USDT region
🪁 Kite following the upward trajectory
📉 MA(99) below the price, indicating a positive structure in the short term
The kite went up… and the chart went along! 🪁🚀📈
BTC/USDT shows an upward move in the short term, with the price reaching the 79,274 USDT area. The rising line highlights the appreciation path, while the colorful kite visually represents the strength of the buying move.
📊 Chart highlights:
📈 Recent bullish move
🟢 Bullish candles gaining strength
🚀 Price testing the 79,274 USDT region
🪁 Kite following the upward trajectory
📉 MA(99) below the price, indicating a positive structure in the short term
The kite went up… and the chart went along! 🪁🚀📈