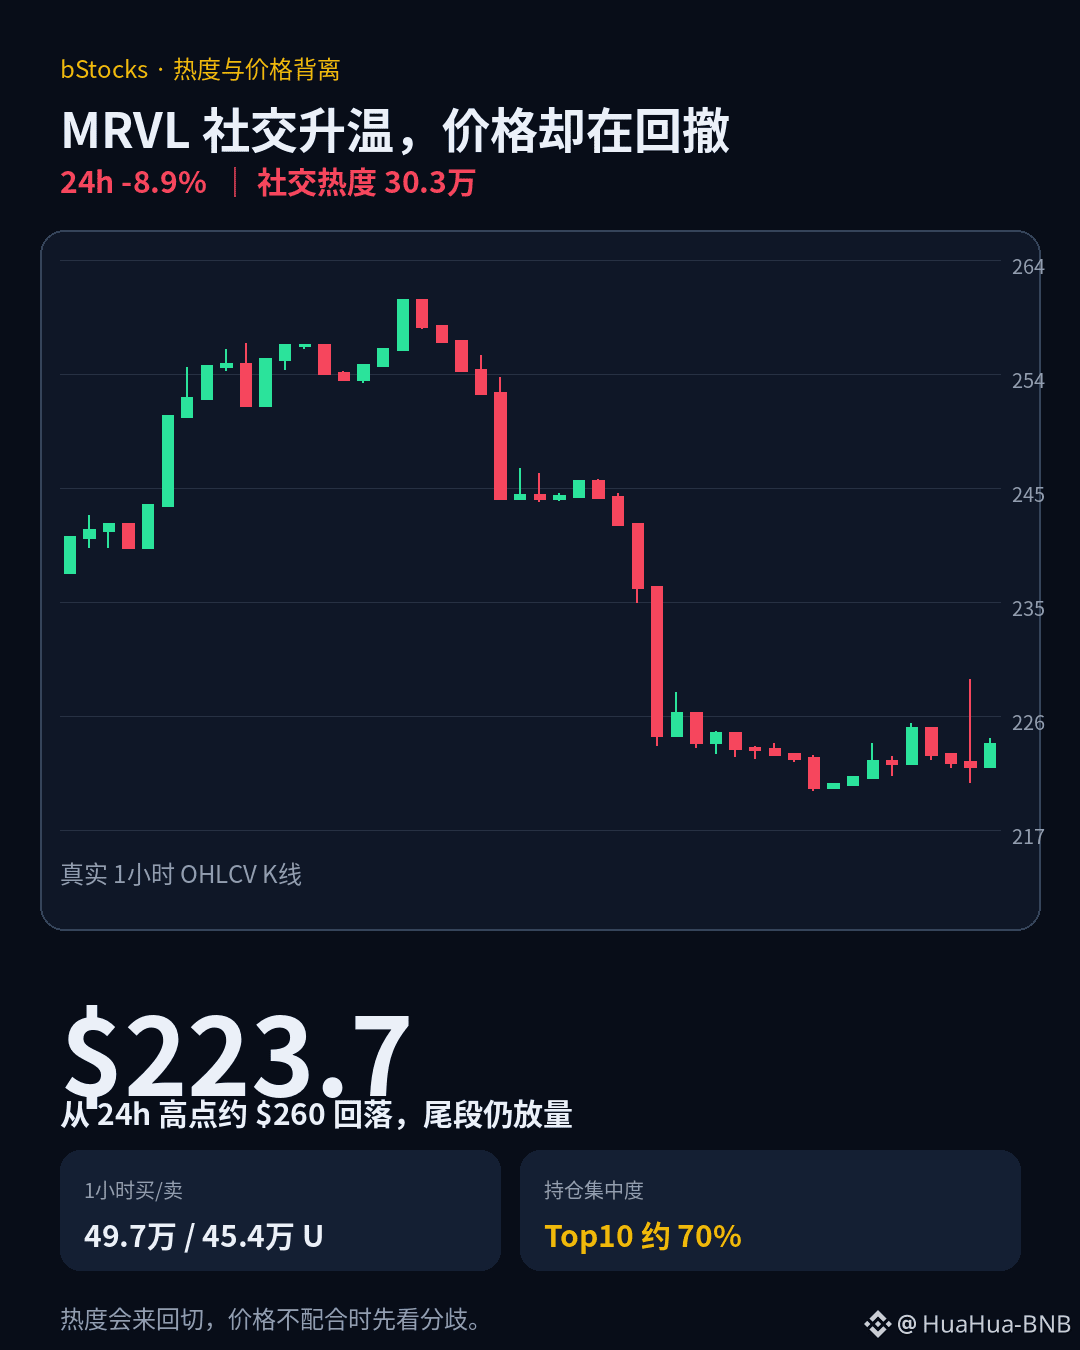

The social buzz has surged to 303,000—yet the price of $MRVL is going down: 24h -8.9%.
In this 1-hour real candlestick chart, MRVL has dropped all the way from about $260 to $223.7, with volume still picking up in the final segment. What’s even more interesting is that social discussions are still heating up, while the market is giving a different answer.
I’m going to treat this as a sample of a “clash between hype and price”: in the 1-hour window, buys/sells are about 497,000/454,000 U, with Top10 holdings at roughly 70%. Hype doesn’t equal follow-through—until the price has clearly stopped falling, any rebound could just be a breath of emotion.
A tokenized version isn’t the same as directly holding the underlying asset; on-chain depth and concentration of holdings can also amplify volatility. When you see a chart where the buzz doesn’t cool down but the price drops first, do you focus on trading activity, or only on the narrative?
$MRVL #bStocks #RWA
In this 1-hour real candlestick chart, MRVL has dropped all the way from about $260 to $223.7, with volume still picking up in the final segment. What’s even more interesting is that social discussions are still heating up, while the market is giving a different answer.
I’m going to treat this as a sample of a “clash between hype and price”: in the 1-hour window, buys/sells are about 497,000/454,000 U, with Top10 holdings at roughly 70%. Hype doesn’t equal follow-through—until the price has clearly stopped falling, any rebound could just be a breath of emotion.
A tokenized version isn’t the same as directly holding the underlying asset; on-chain depth and concentration of holdings can also amplify volatility. When you see a chart where the buzz doesn’t cool down but the price drops first, do you focus on trading activity, or only on the narrative?
$MRVL #bStocks #RWA