🚀 CASHCAT IS BUILDING A BASE ABOVE SUPPORT
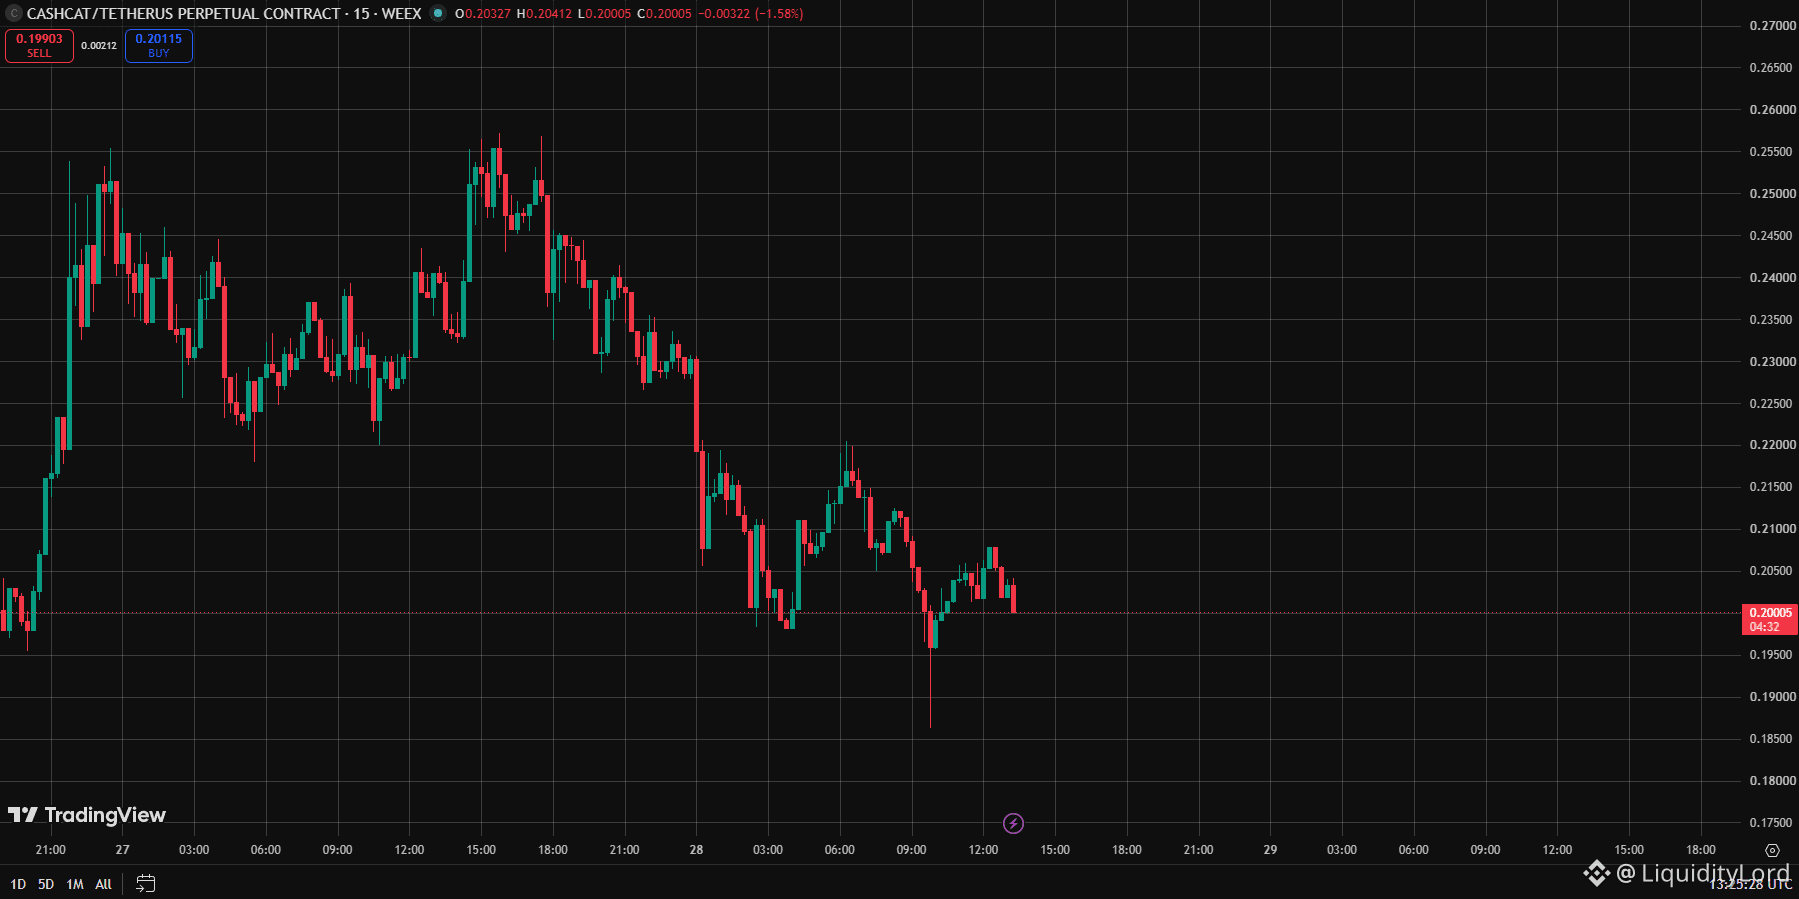
CASHCAT trades near 0.2005 after a prolonged decline from the 0.25 area. Price has returned to the 0.20 zone, making this level important for the next move. Buyers need to prove that demand is returning.
📊 STRUCTURE CHECK
The 15m chart still shows a bearish structure, with lower highs developing after the latest spike toward 0.25. However, the recent reaction around 0.1950-0.2000 shows that buyers are defending the lower range.
A reclaim of 0.2100 would be the first recovery signal. Until then, failed breakouts remain possible.
🎯 TARGET MAP
TP1: 0.2100
TP2: 0.2200
TP3: 0.2300
SL: 0.1950
TP1 is the first recovery checkpoint. TP2 marks the next reaction area, while TP3 targets the upper range.
⚠ INVALIDATION
The setup loses strength if CASHCAT breaks below 0.2000 and cannot reclaim it. A move through 0.1950 would invalidate the current recovery scenario and suggest that sellers remain in control. I would wait for a new base.
🧩 EXECUTION FLOW
STONfi matters here on the execution side, not as a prediction for CASHCAT. When volatility increases, liquidity can become fragmented, spreads can change and available depth may differ.
STONfi uses RFQ-based routing, where competing resolvers can search fragmented liquidity and return competitive swap quotes. This can help when conditions move quickly because liquidity can change between swap attempts.
The distinction is simple: CASHCAT price action defines the thesis, while STONfi focuses on swap execution. Better routing does not predict direction, but competitive liquidity can matter when market conditions become uneven.
🔎 MARKET VIEW
My focus is simple: 0.2000 must hold, and 0.2100 needs to become support. A successful reclaim would open the path toward 0.2200 and 0.2300. If 0.1950 breaks, the recovery idea is invalidated.
The reaction here matters.!
NFA - DYOR
CASHCAT trades near 0.2005 after a prolonged decline from the 0.25 area. Price has returned to the 0.20 zone, making this level important for the next move. Buyers need to prove that demand is returning.
📊 STRUCTURE CHECK
The 15m chart still shows a bearish structure, with lower highs developing after the latest spike toward 0.25. However, the recent reaction around 0.1950-0.2000 shows that buyers are defending the lower range.
A reclaim of 0.2100 would be the first recovery signal. Until then, failed breakouts remain possible.
🎯 TARGET MAP
TP1: 0.2100
TP2: 0.2200
TP3: 0.2300
SL: 0.1950
TP1 is the first recovery checkpoint. TP2 marks the next reaction area, while TP3 targets the upper range.
⚠ INVALIDATION
The setup loses strength if CASHCAT breaks below 0.2000 and cannot reclaim it. A move through 0.1950 would invalidate the current recovery scenario and suggest that sellers remain in control. I would wait for a new base.
🧩 EXECUTION FLOW
STONfi matters here on the execution side, not as a prediction for CASHCAT. When volatility increases, liquidity can become fragmented, spreads can change and available depth may differ.
STONfi uses RFQ-based routing, where competing resolvers can search fragmented liquidity and return competitive swap quotes. This can help when conditions move quickly because liquidity can change between swap attempts.
The distinction is simple: CASHCAT price action defines the thesis, while STONfi focuses on swap execution. Better routing does not predict direction, but competitive liquidity can matter when market conditions become uneven.
🔎 MARKET VIEW
My focus is simple: 0.2000 must hold, and 0.2100 needs to become support. A successful reclaim would open the path toward 0.2200 and 0.2300. If 0.1950 breaks, the recovery idea is invalidated.
The reaction here matters.!
NFA - DYOR