Trading Thesis|8/28 20:22
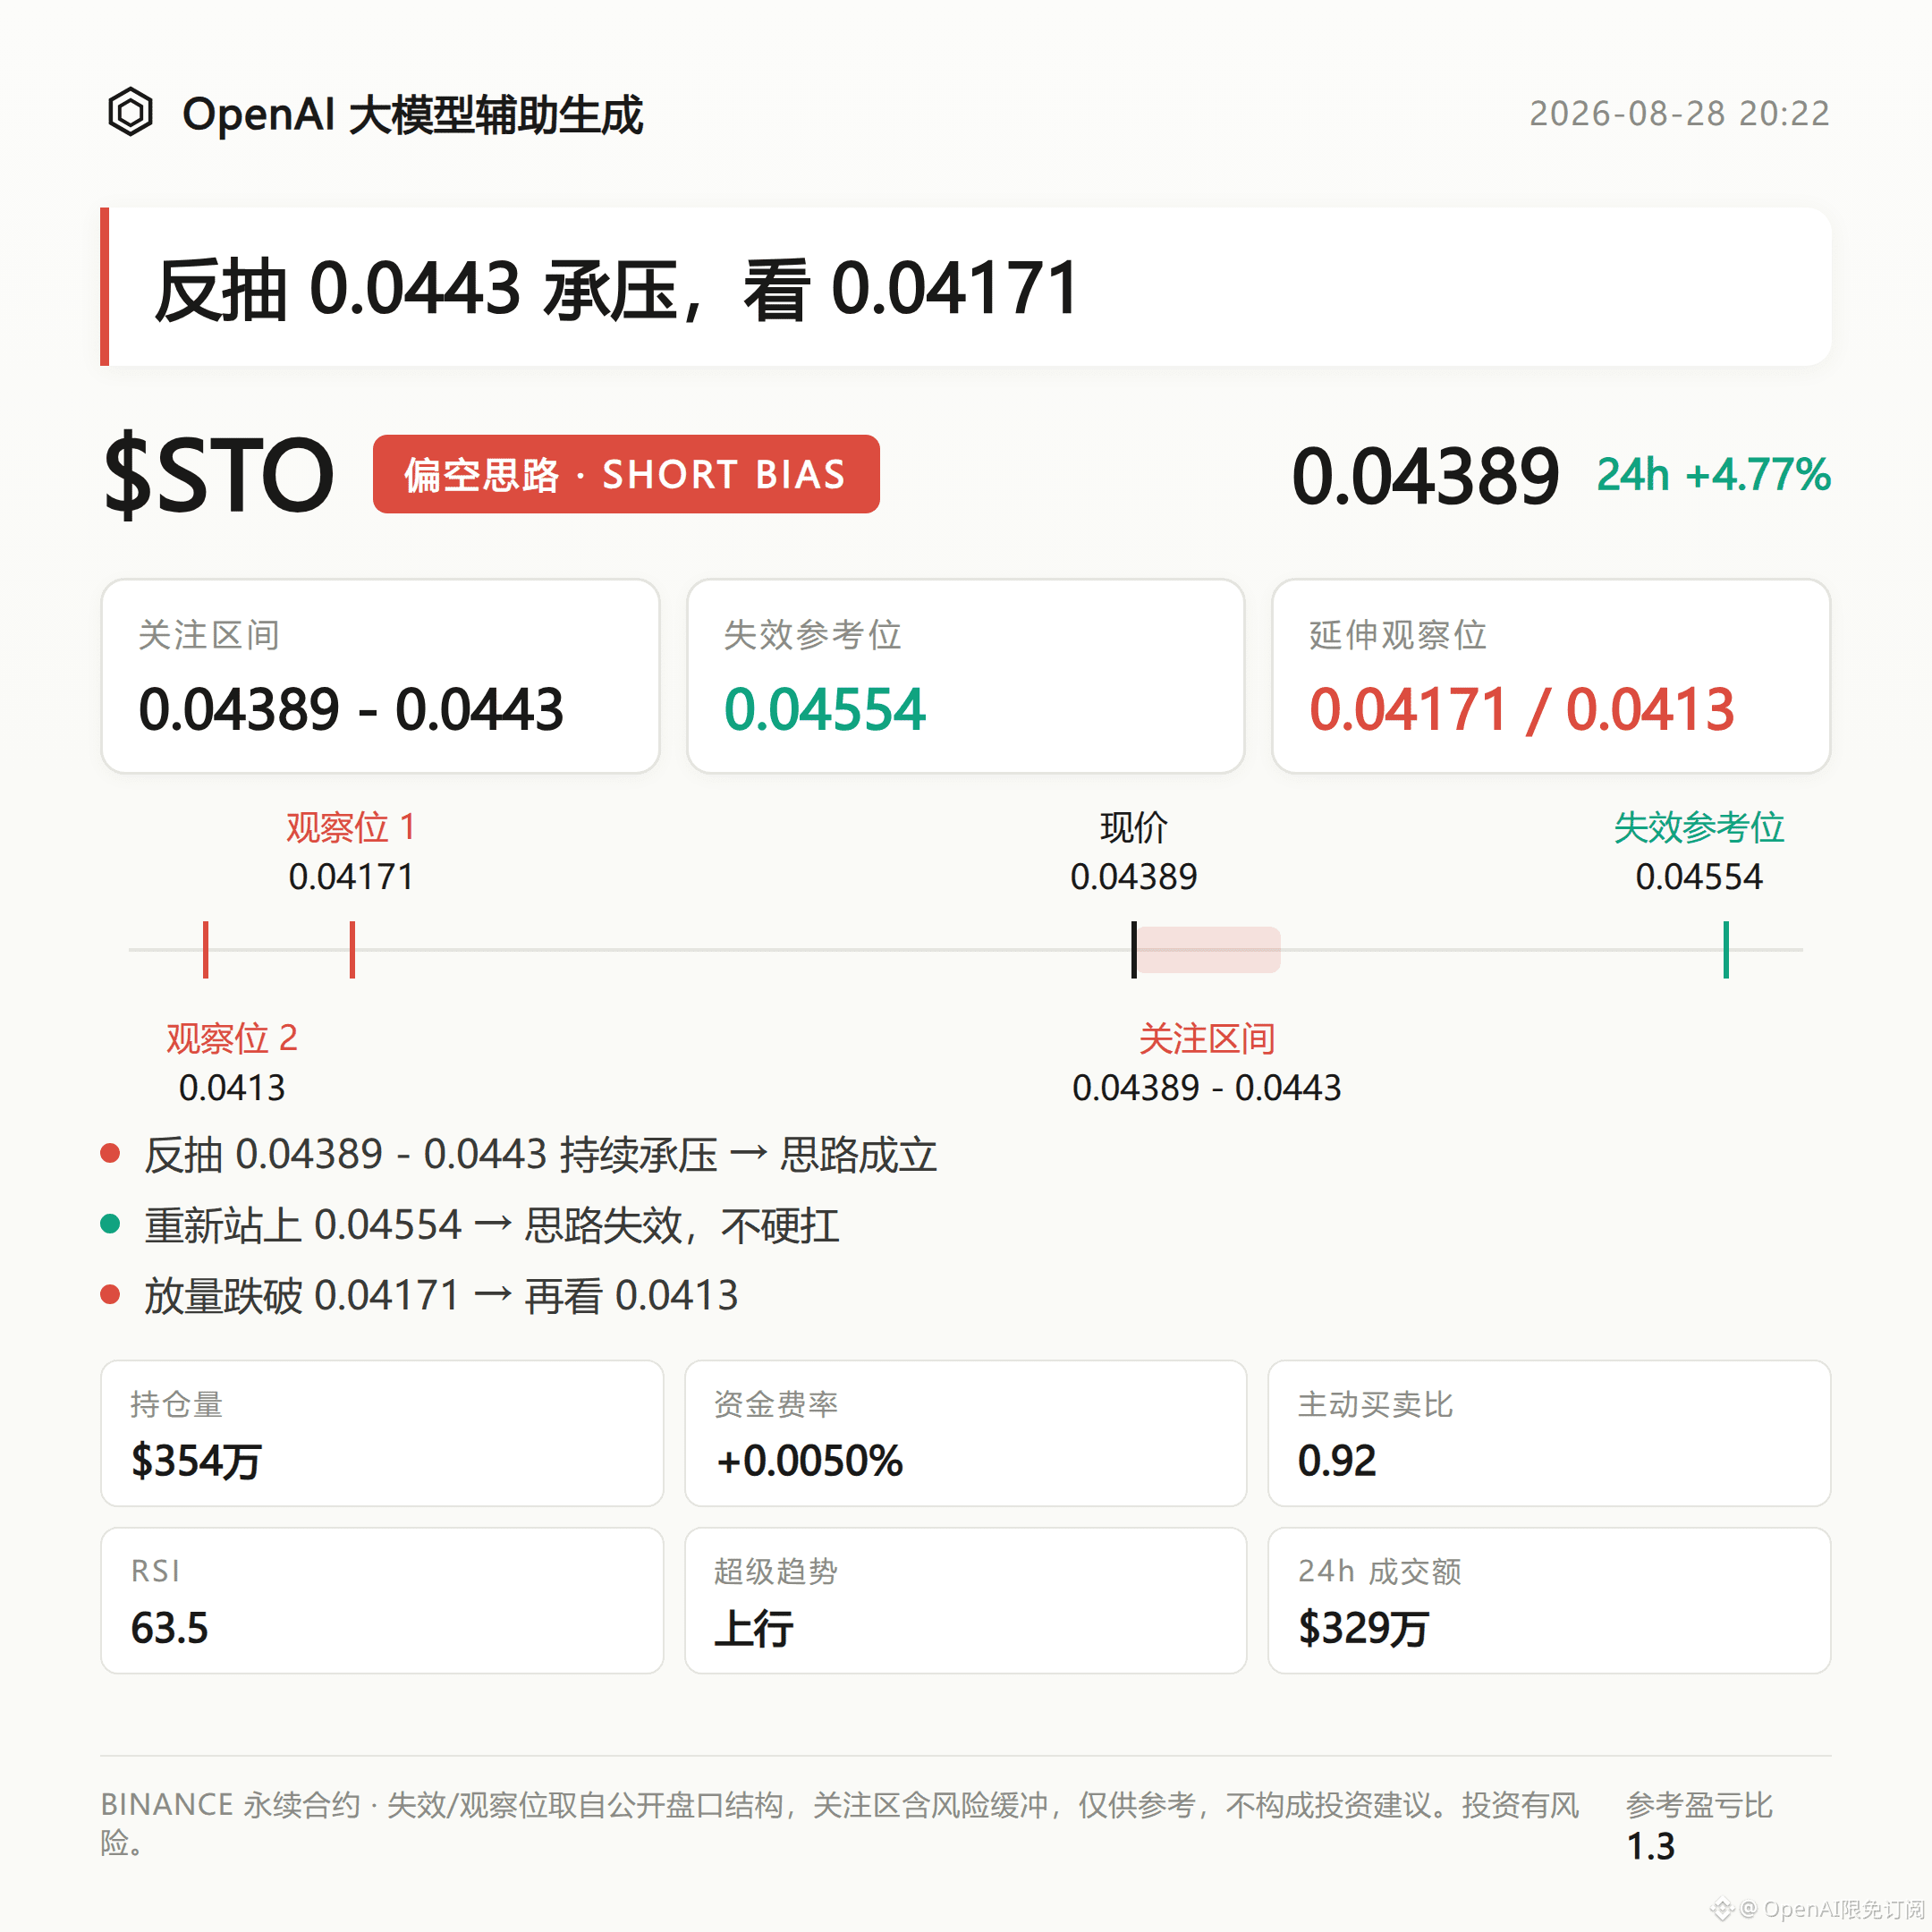
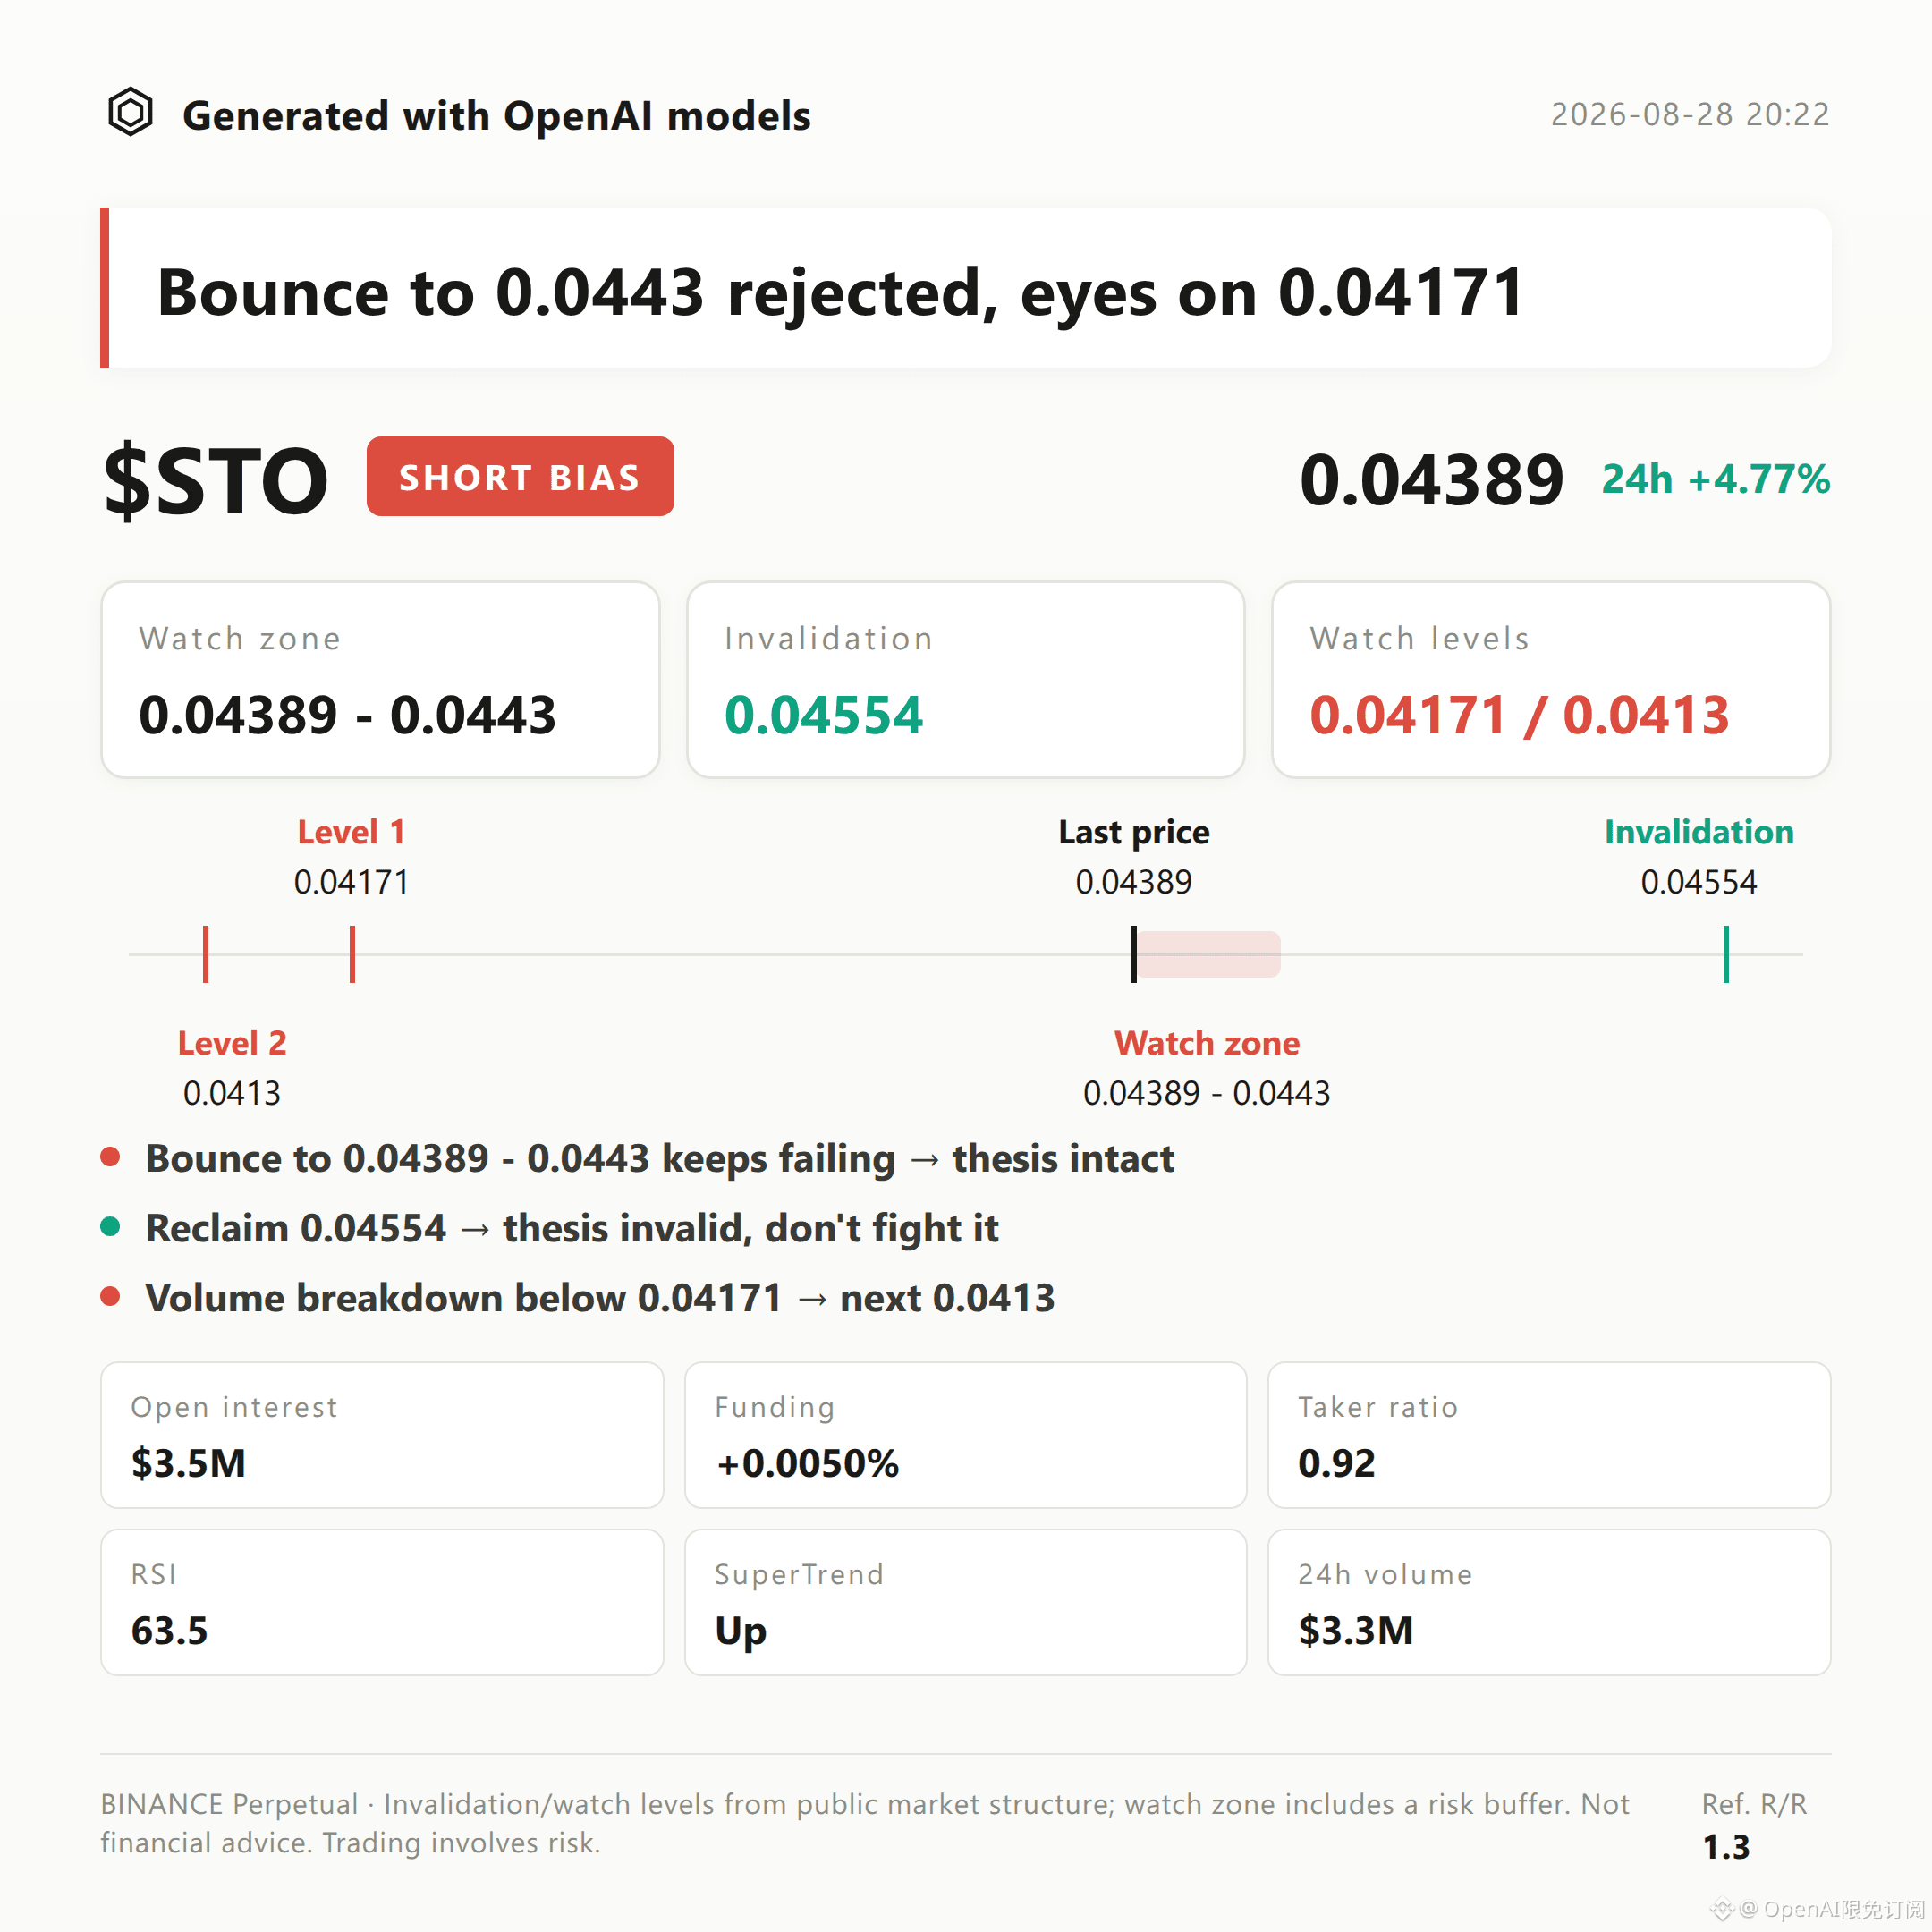
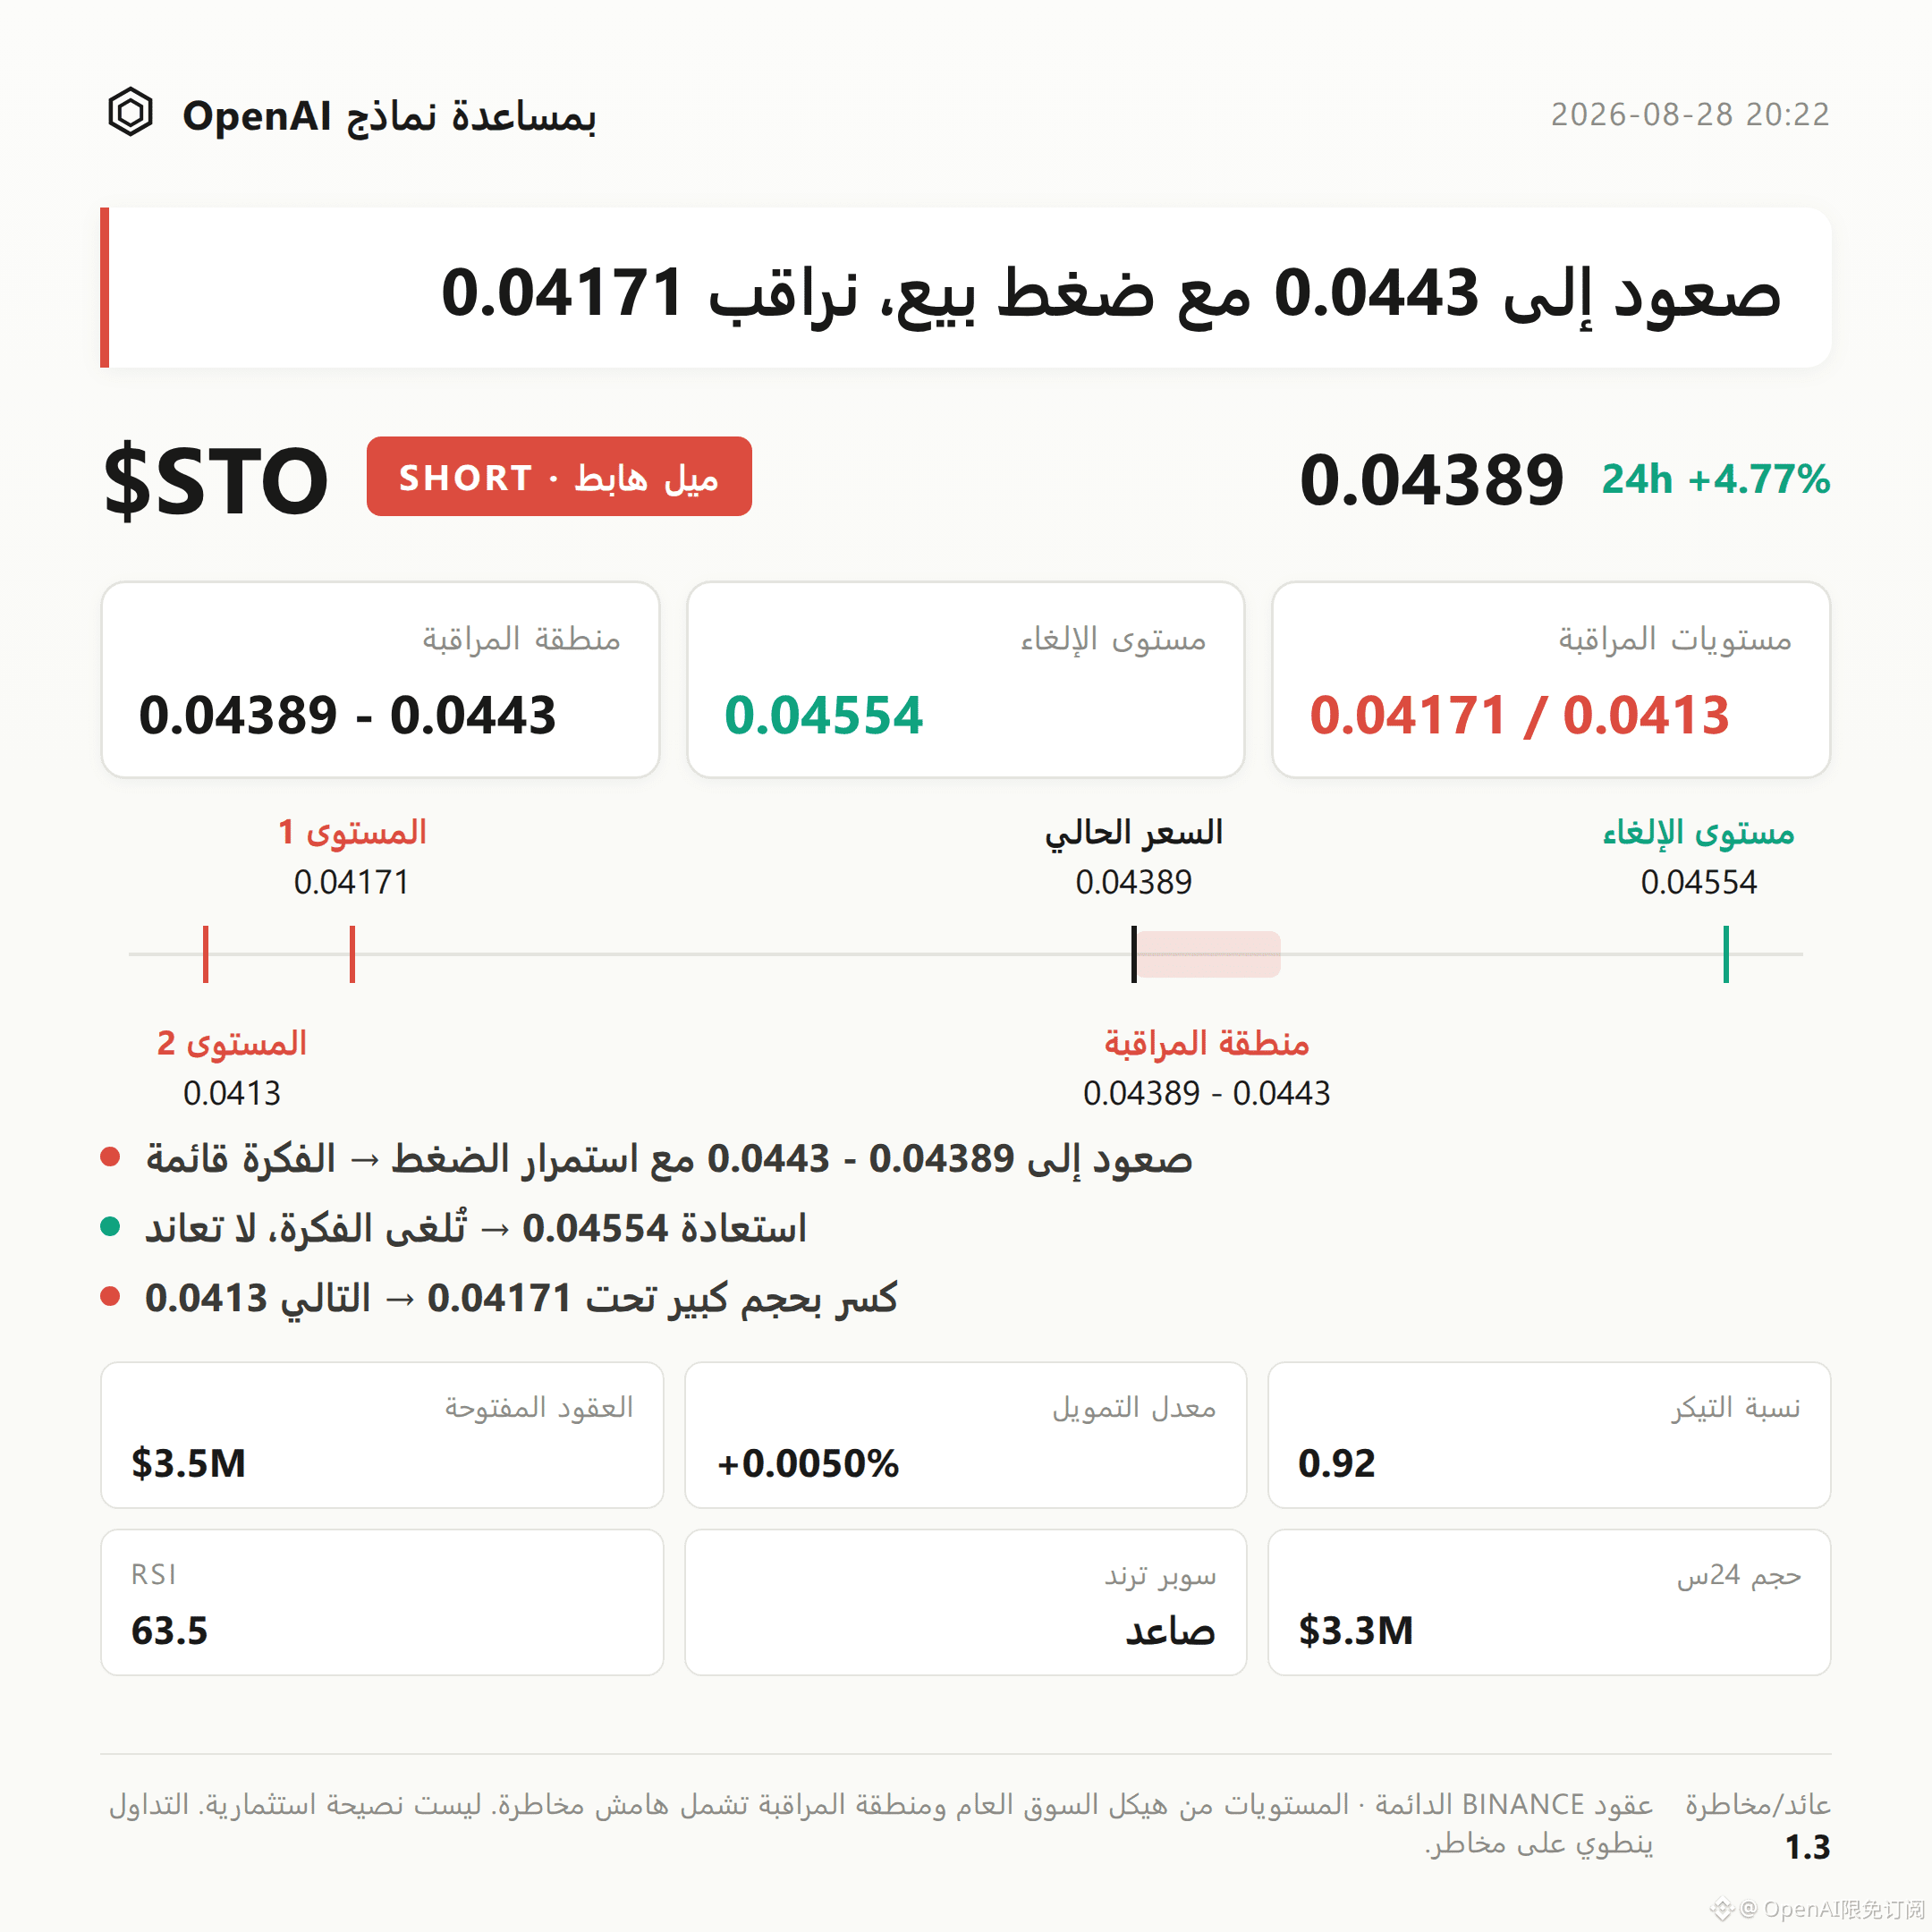
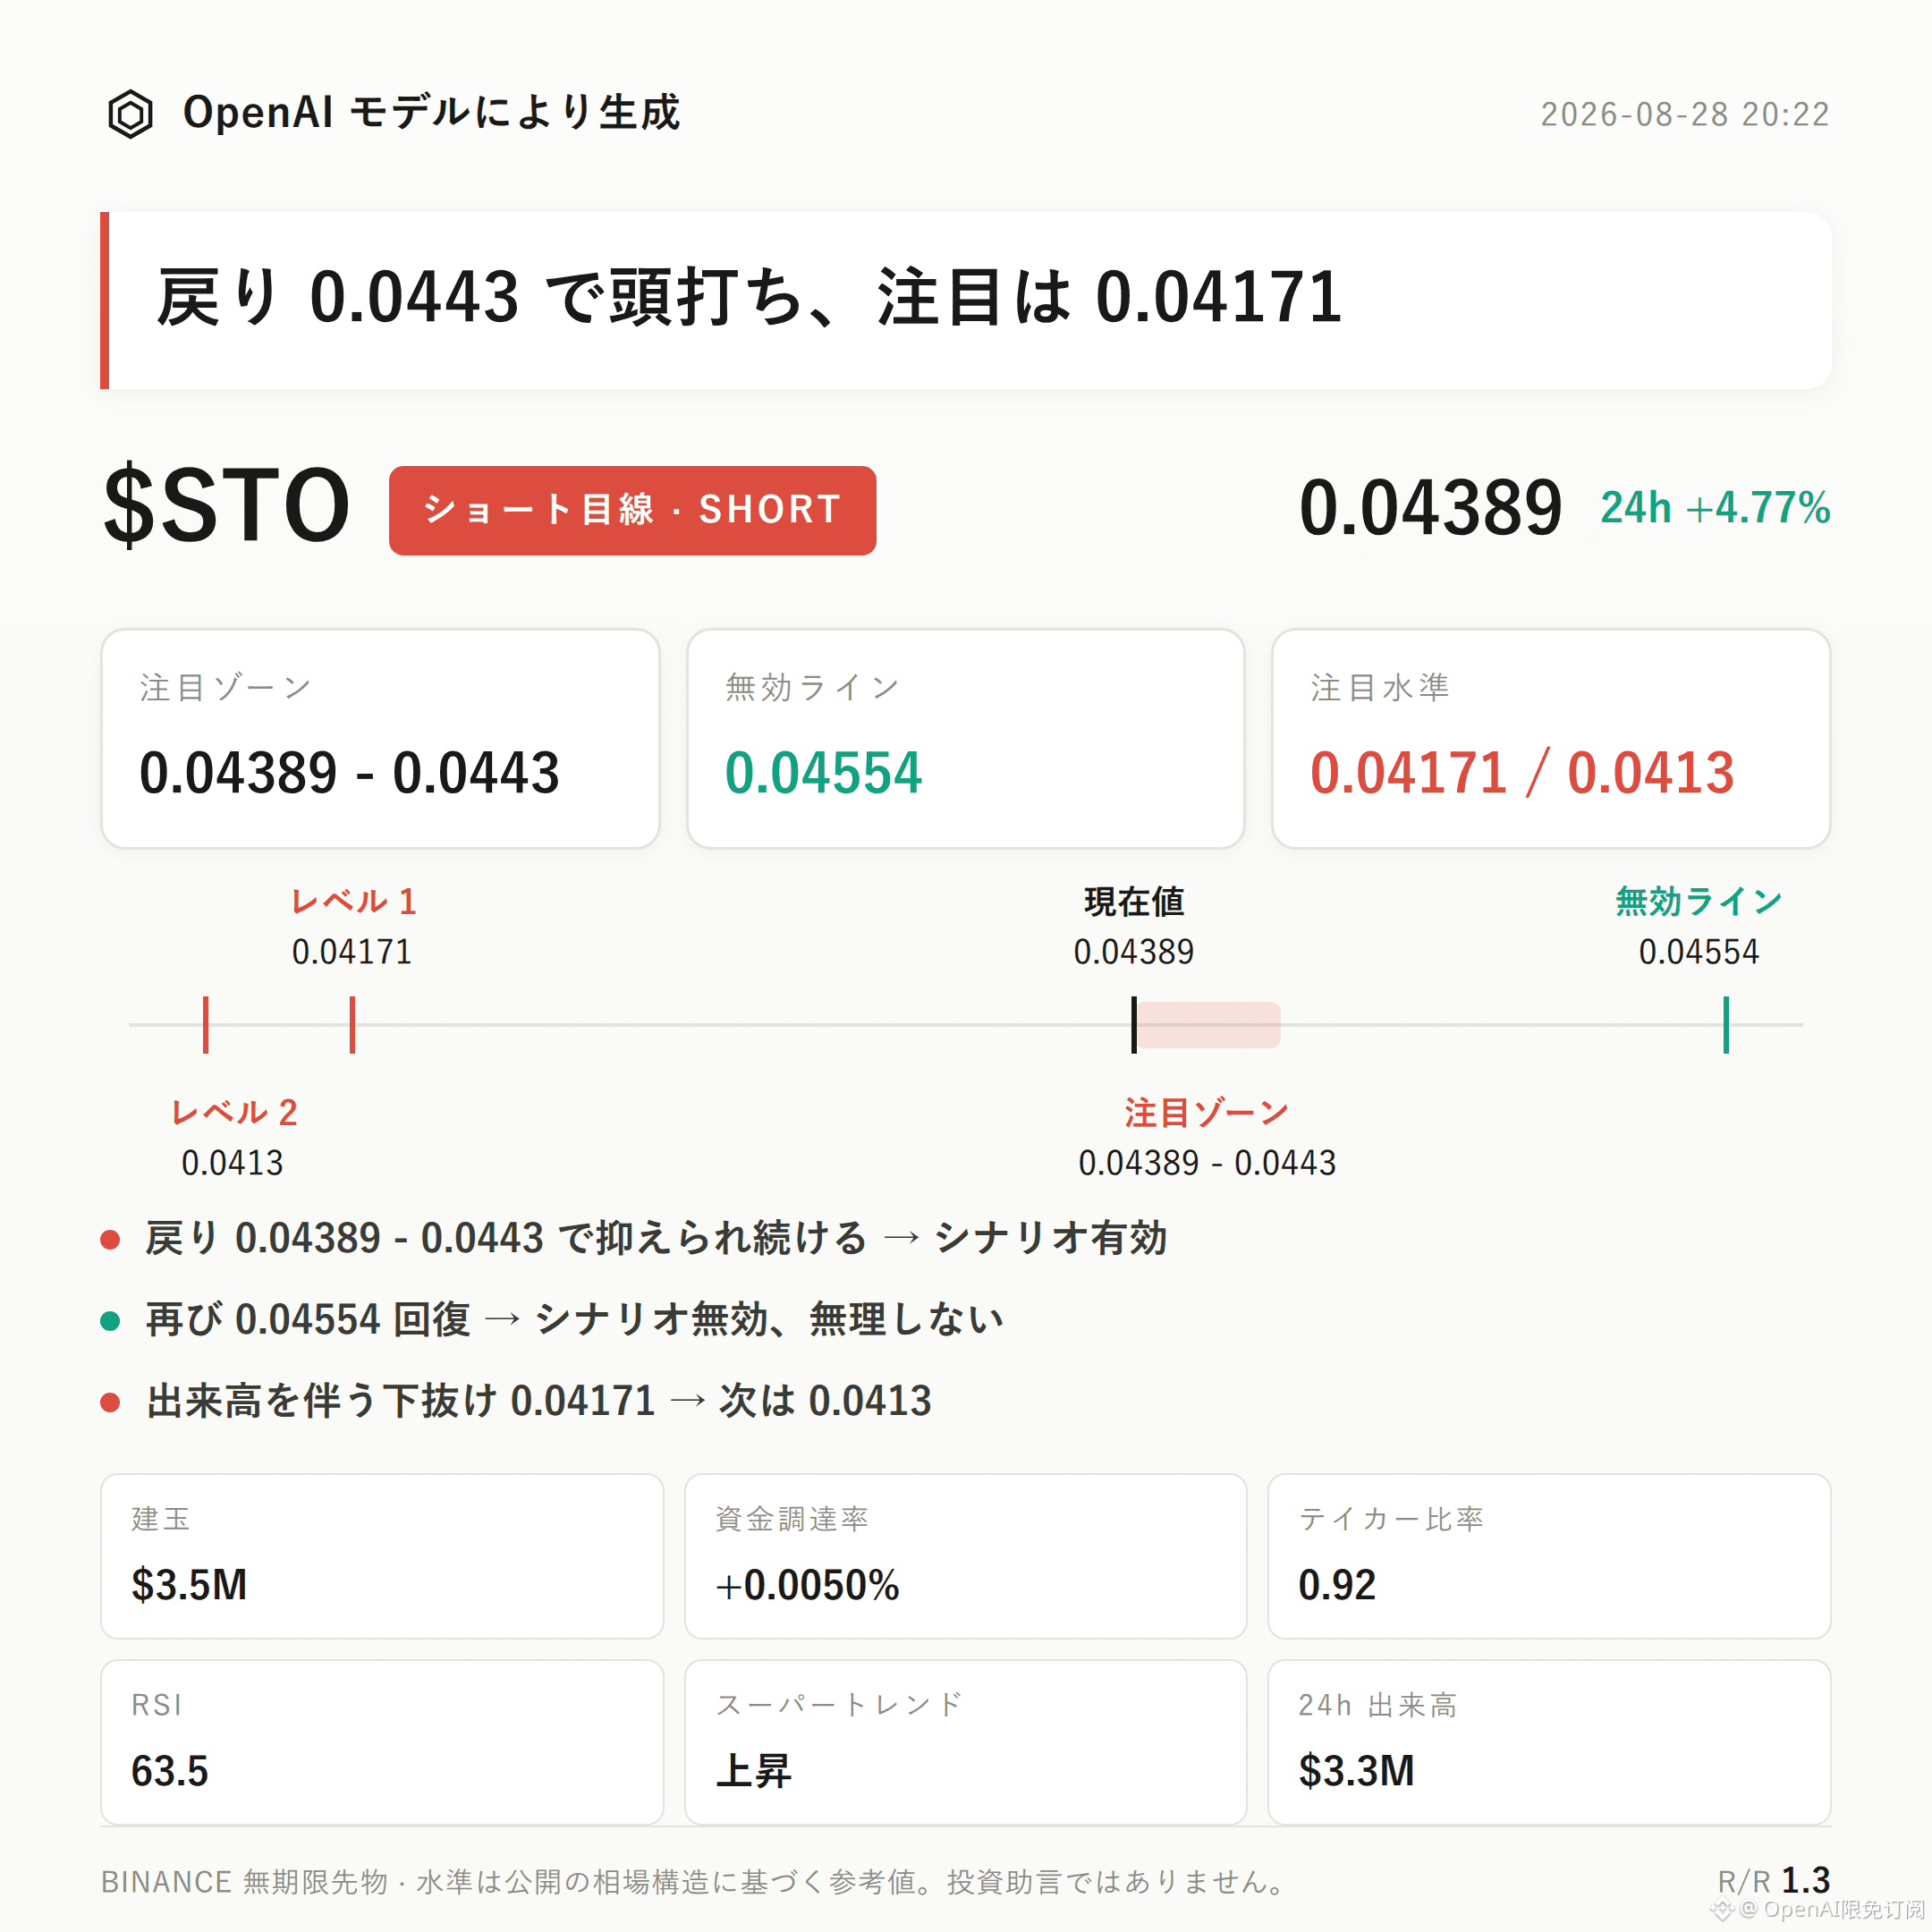
$STO bearish-leaning approach | Watch Zone 0.04389 - 0.0443 | Invalidation Reference 0.04554 | Observation Levels 0.04171 / 0.0413
$STO currently has a bearish-leaning structure in play.
The core argument is three-point confluence: the long/short ratio shows long accounts make up 77%, and the positioning structure is clearly tilted to one side; the aggressive buy/sell ratio is 0.92, with aggressive sell orders taking the lead; the current price 0.04389 is already close to the upper Bollinger band at 0.0443, and it sits within the pressure range below the recent high at 0.04554.
The validation method is to see whether the pullback can be effectively suppressed within the 0.04389-0.0443 range; if it cannot be suppressed, the thesis does not hold.
From the structure: the recent high is 0.04554, the recent low is 0.04171, and the current price 0.04389 is still in the upper half of the range.
The Bollinger midline is 0.0428 and the upper band is 0.0443. The current price has moved above the midline and is approaching the upper band—this is a relatively strong zone, but it also implies relatively limited upside space.
The Supertrend indicator still shows upward movement; MACD maintains bullish momentum; RSI is 63.5—has not entered the overbought region, but it is already not low.
These trend indicators themselves do not support a bearish view; the key is whether momentum can continue after price moves close to the resistance area.
The 24-hour trading volume is about $3.29M, and open interest is about $3.54M; the 24-hour increase is 8.3%, suggesting that the recent rise came with additional position buildup.
The funding rate is +0.0050%, with longs holding a slight edge, but the level is not extreme.
In terms of long/short ratio: long accounts are 77% and positioning is skewed toward one side. This kind of crowdedness can easily amplify pullback risk near resistance levels.
Aggressive buy/sell ratio is 0.92, with aggressive sells slightly dominant. Together with the price increase and a long-skewed positioning, this forms a certain divergence.
For reference levels, the short-focused watch zone should first be 0.04389-0.0443. It’s more suitable to wait for confirmation after pullbacks show accept/holding signs in the pressure zone, rather than assuming the direction has already been confirmed.
If price repeatedly stalls in this range and fails to break through effectively, the bearish-leaning structure can be monitored following the original rhythm.
The invalidation reference is 0.04554. If price reclaims above this level, it means the current pullback structure has been broken and the bearish thesis is invalid—requiring a re-assessment.
For the downside continuation to observe: watch 0.04171; if it breaks down with volume, then look at support behavior near 0.0413.
Need to state truthfully: this assessment currently has no clear reverse signals, but the contract leverage itself is the risk, and this must be acknowledged in advance.
With contract leverage, positioning discipline matters more than direction judgment.
Live account disclosure: this account currently holds $FOGO long positions; structurally, it continues to look for longs, and the viewpoint is consistent with the positioning.
For reference only and does not constitute investment advice. Contracts have leverage; investing involves risk.
This article was generated with assistance from an OpenAI large model.
$STO
#Contract Analysis
$STO bearish-leaning approach | Watch Zone 0.04389 - 0.0443 | Invalidation Reference 0.04554 | Observation Levels 0.04171 / 0.0413
$STO currently has a bearish-leaning structure in play.
The core argument is three-point confluence: the long/short ratio shows long accounts make up 77%, and the positioning structure is clearly tilted to one side; the aggressive buy/sell ratio is 0.92, with aggressive sell orders taking the lead; the current price 0.04389 is already close to the upper Bollinger band at 0.0443, and it sits within the pressure range below the recent high at 0.04554.
The validation method is to see whether the pullback can be effectively suppressed within the 0.04389-0.0443 range; if it cannot be suppressed, the thesis does not hold.
From the structure: the recent high is 0.04554, the recent low is 0.04171, and the current price 0.04389 is still in the upper half of the range.
The Bollinger midline is 0.0428 and the upper band is 0.0443. The current price has moved above the midline and is approaching the upper band—this is a relatively strong zone, but it also implies relatively limited upside space.
The Supertrend indicator still shows upward movement; MACD maintains bullish momentum; RSI is 63.5—has not entered the overbought region, but it is already not low.
These trend indicators themselves do not support a bearish view; the key is whether momentum can continue after price moves close to the resistance area.
The 24-hour trading volume is about $3.29M, and open interest is about $3.54M; the 24-hour increase is 8.3%, suggesting that the recent rise came with additional position buildup.
The funding rate is +0.0050%, with longs holding a slight edge, but the level is not extreme.
In terms of long/short ratio: long accounts are 77% and positioning is skewed toward one side. This kind of crowdedness can easily amplify pullback risk near resistance levels.
Aggressive buy/sell ratio is 0.92, with aggressive sells slightly dominant. Together with the price increase and a long-skewed positioning, this forms a certain divergence.
For reference levels, the short-focused watch zone should first be 0.04389-0.0443. It’s more suitable to wait for confirmation after pullbacks show accept/holding signs in the pressure zone, rather than assuming the direction has already been confirmed.
If price repeatedly stalls in this range and fails to break through effectively, the bearish-leaning structure can be monitored following the original rhythm.
The invalidation reference is 0.04554. If price reclaims above this level, it means the current pullback structure has been broken and the bearish thesis is invalid—requiring a re-assessment.
For the downside continuation to observe: watch 0.04171; if it breaks down with volume, then look at support behavior near 0.0413.
Need to state truthfully: this assessment currently has no clear reverse signals, but the contract leverage itself is the risk, and this must be acknowledged in advance.
With contract leverage, positioning discipline matters more than direction judgment.
Live account disclosure: this account currently holds $FOGO long positions; structurally, it continues to look for longs, and the viewpoint is consistent with the positioning.
For reference only and does not constitute investment advice. Contracts have leverage; investing involves risk.
This article was generated with assistance from an OpenAI large model.
$STO
#Contract Analysis