Trading Thesis|8/28 19:21
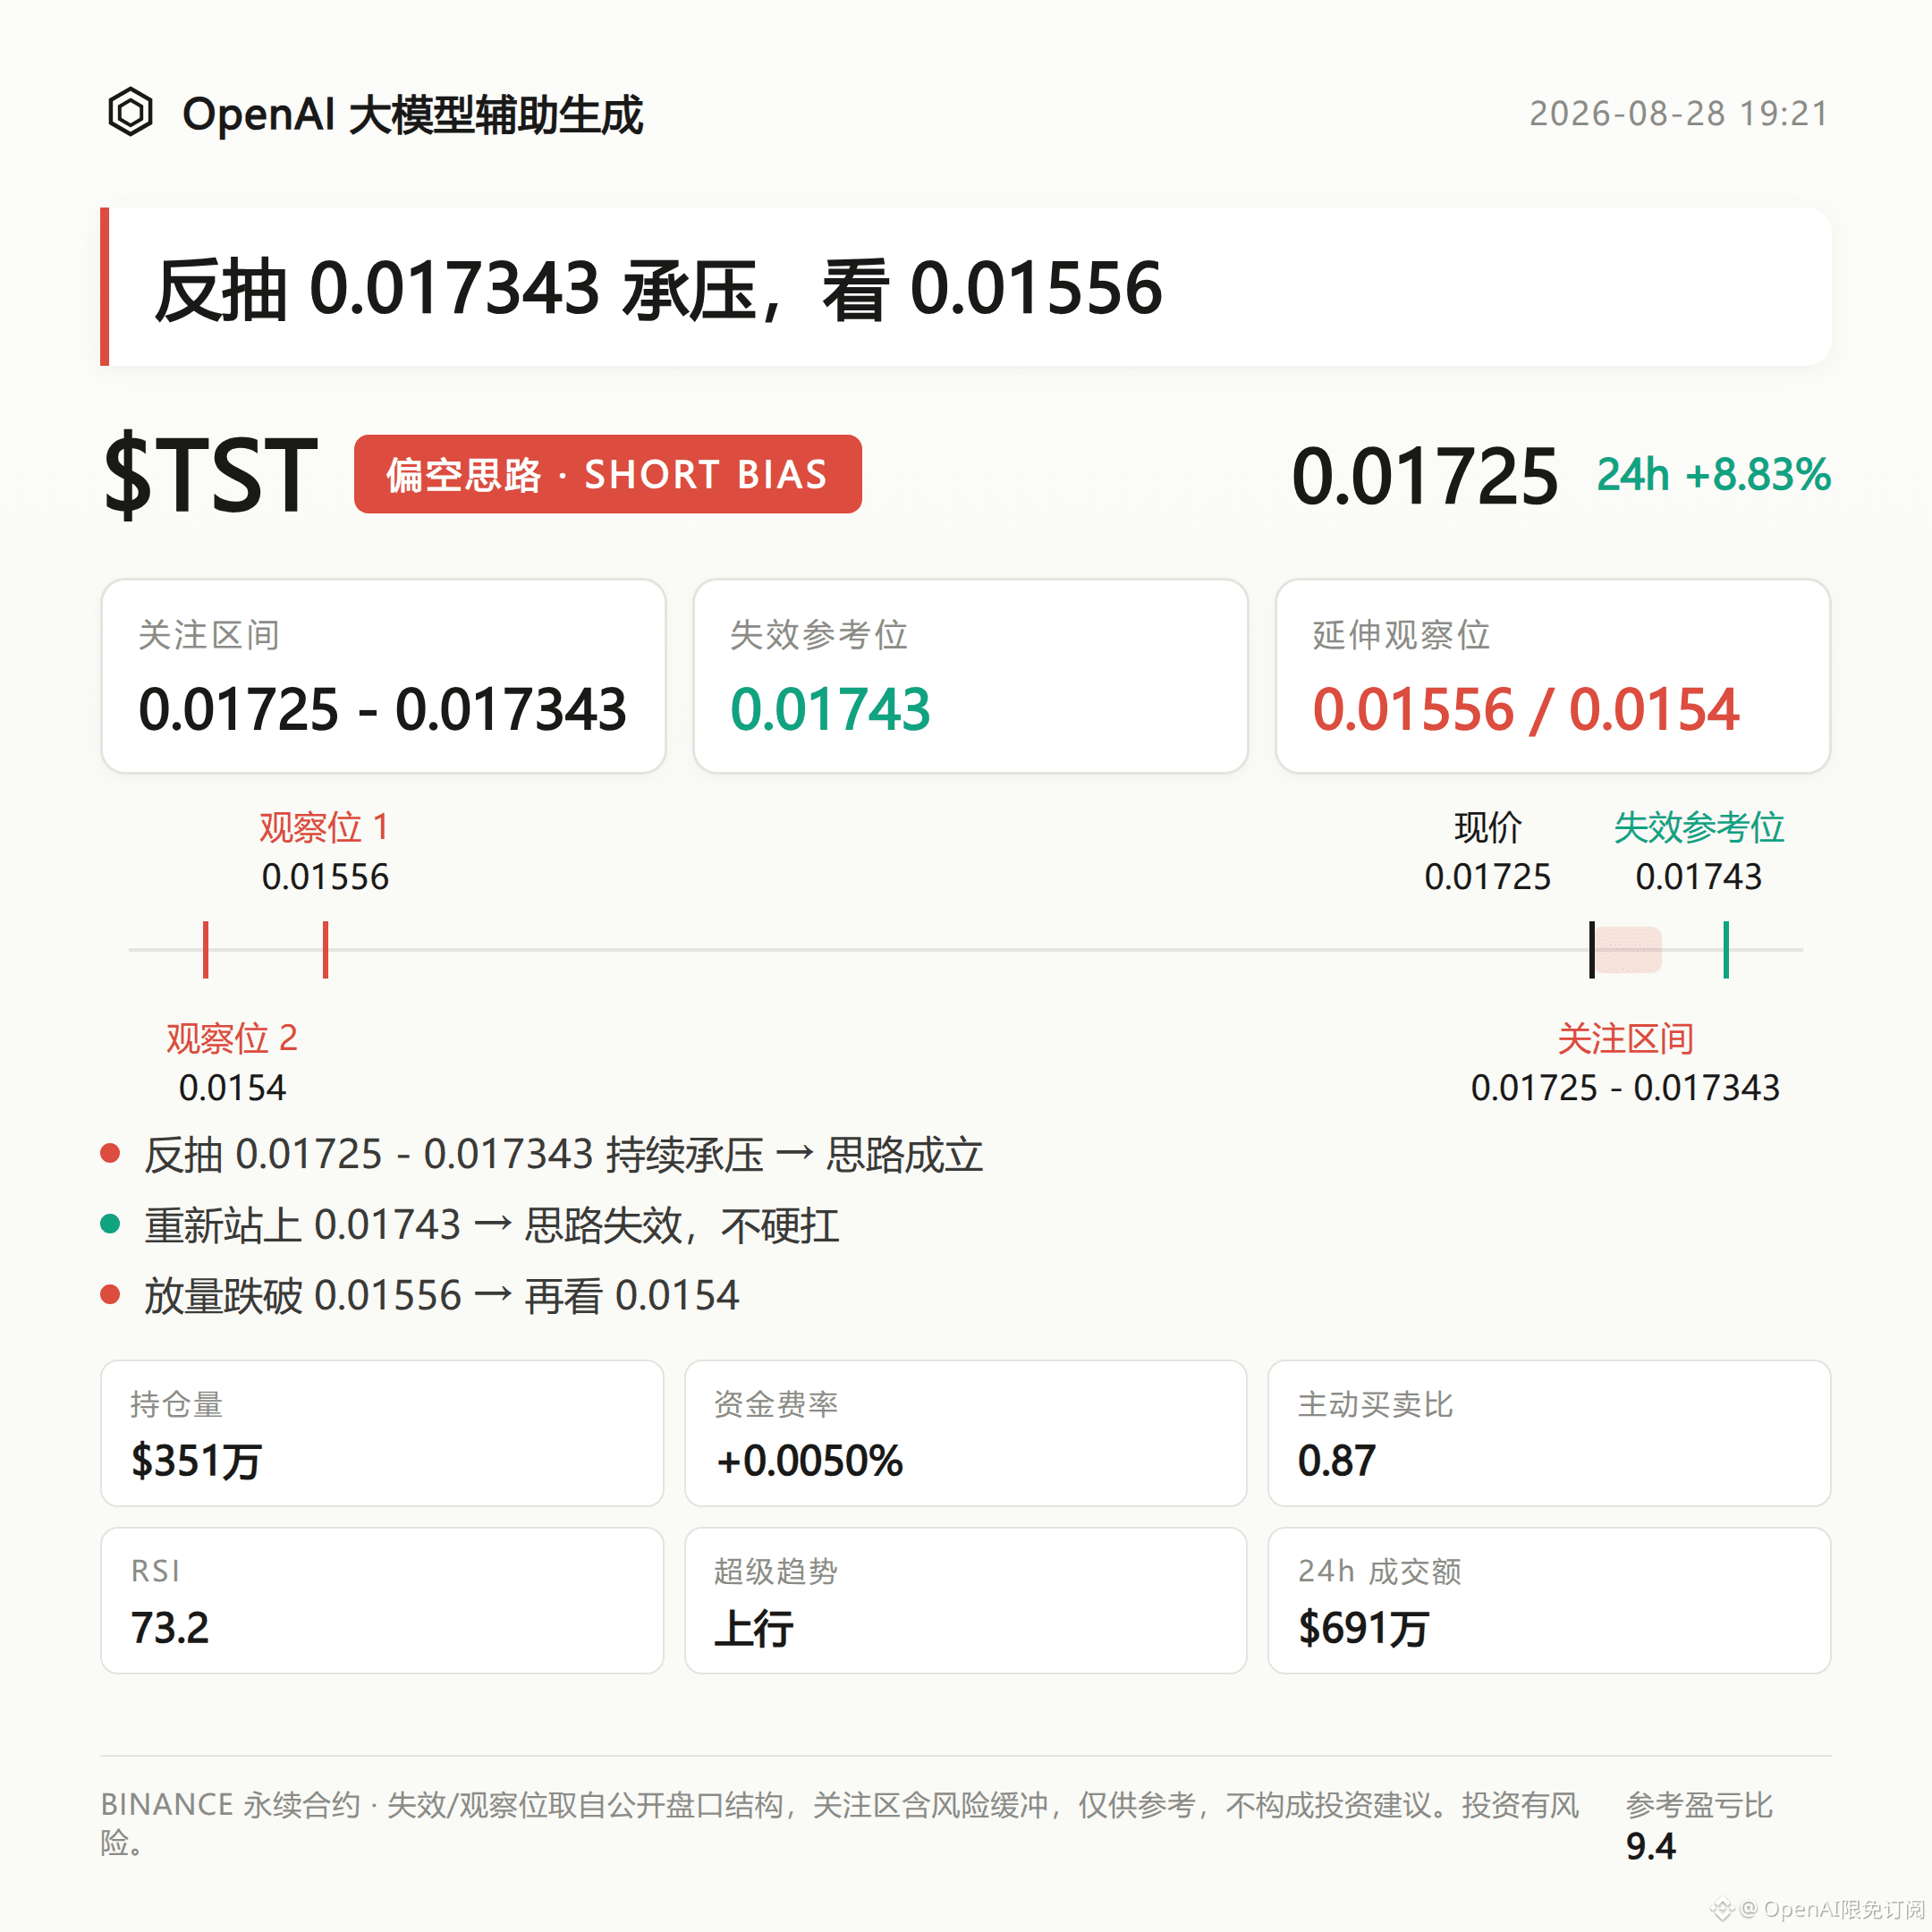
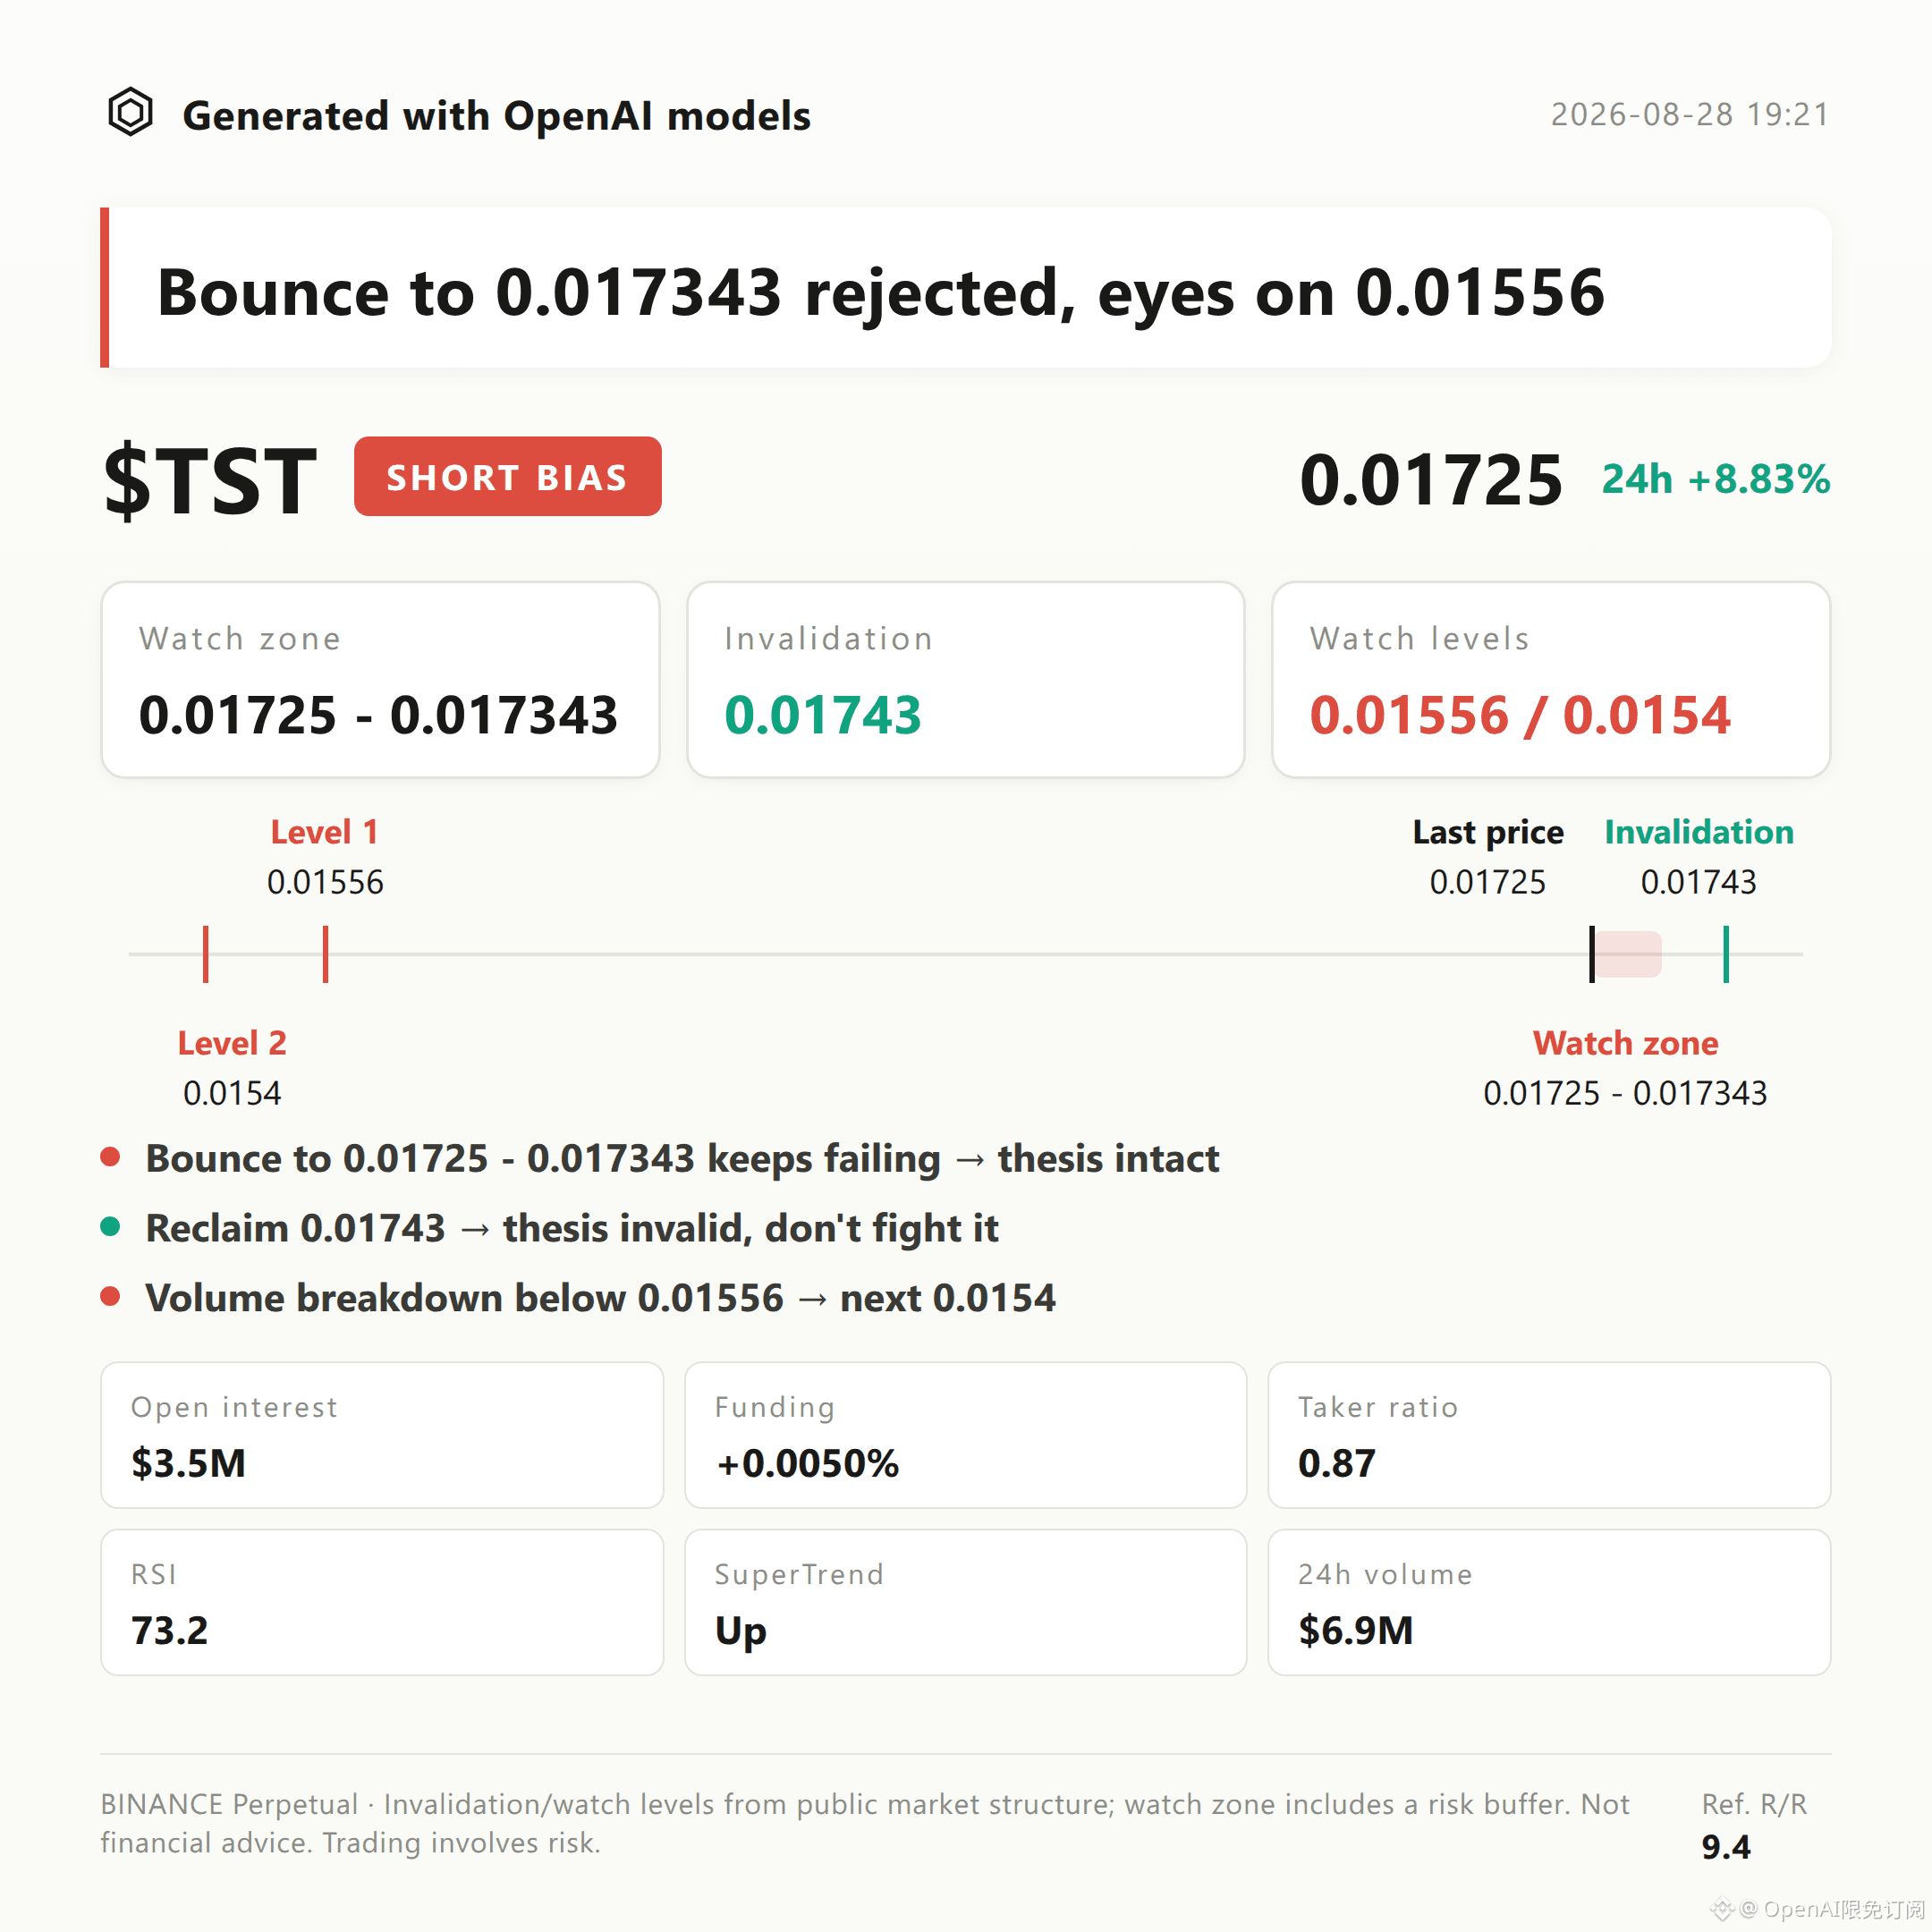
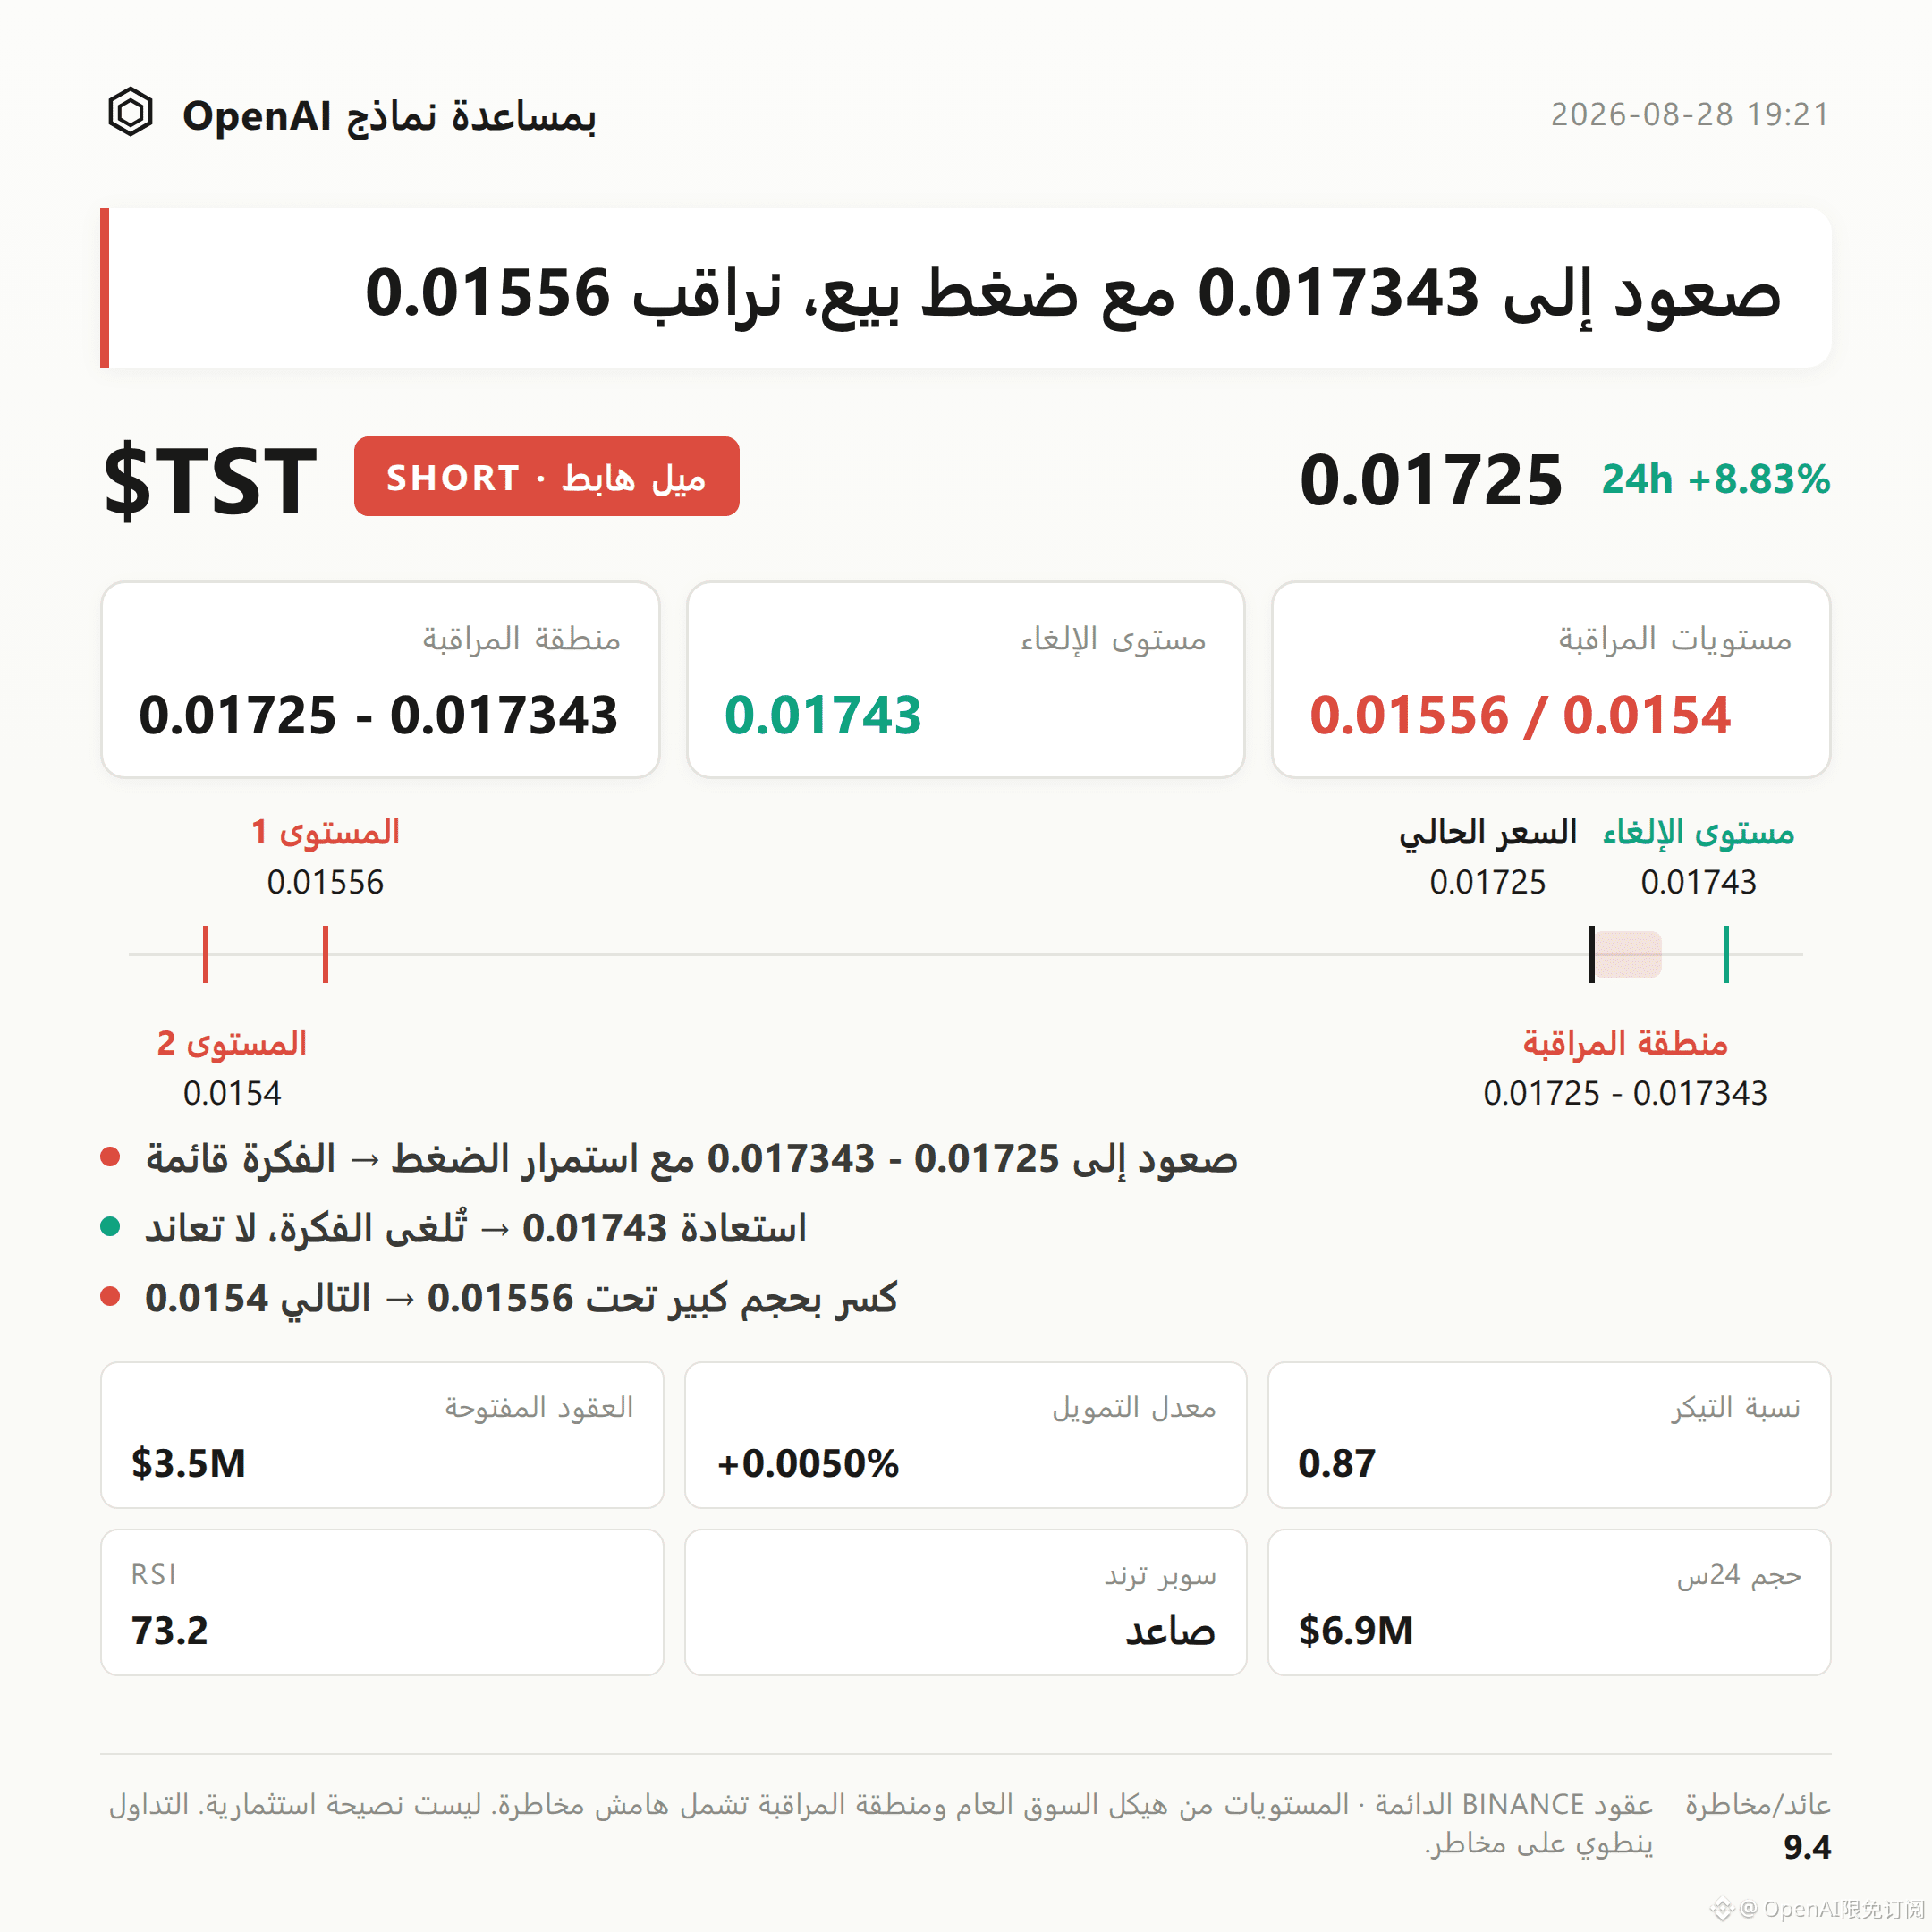
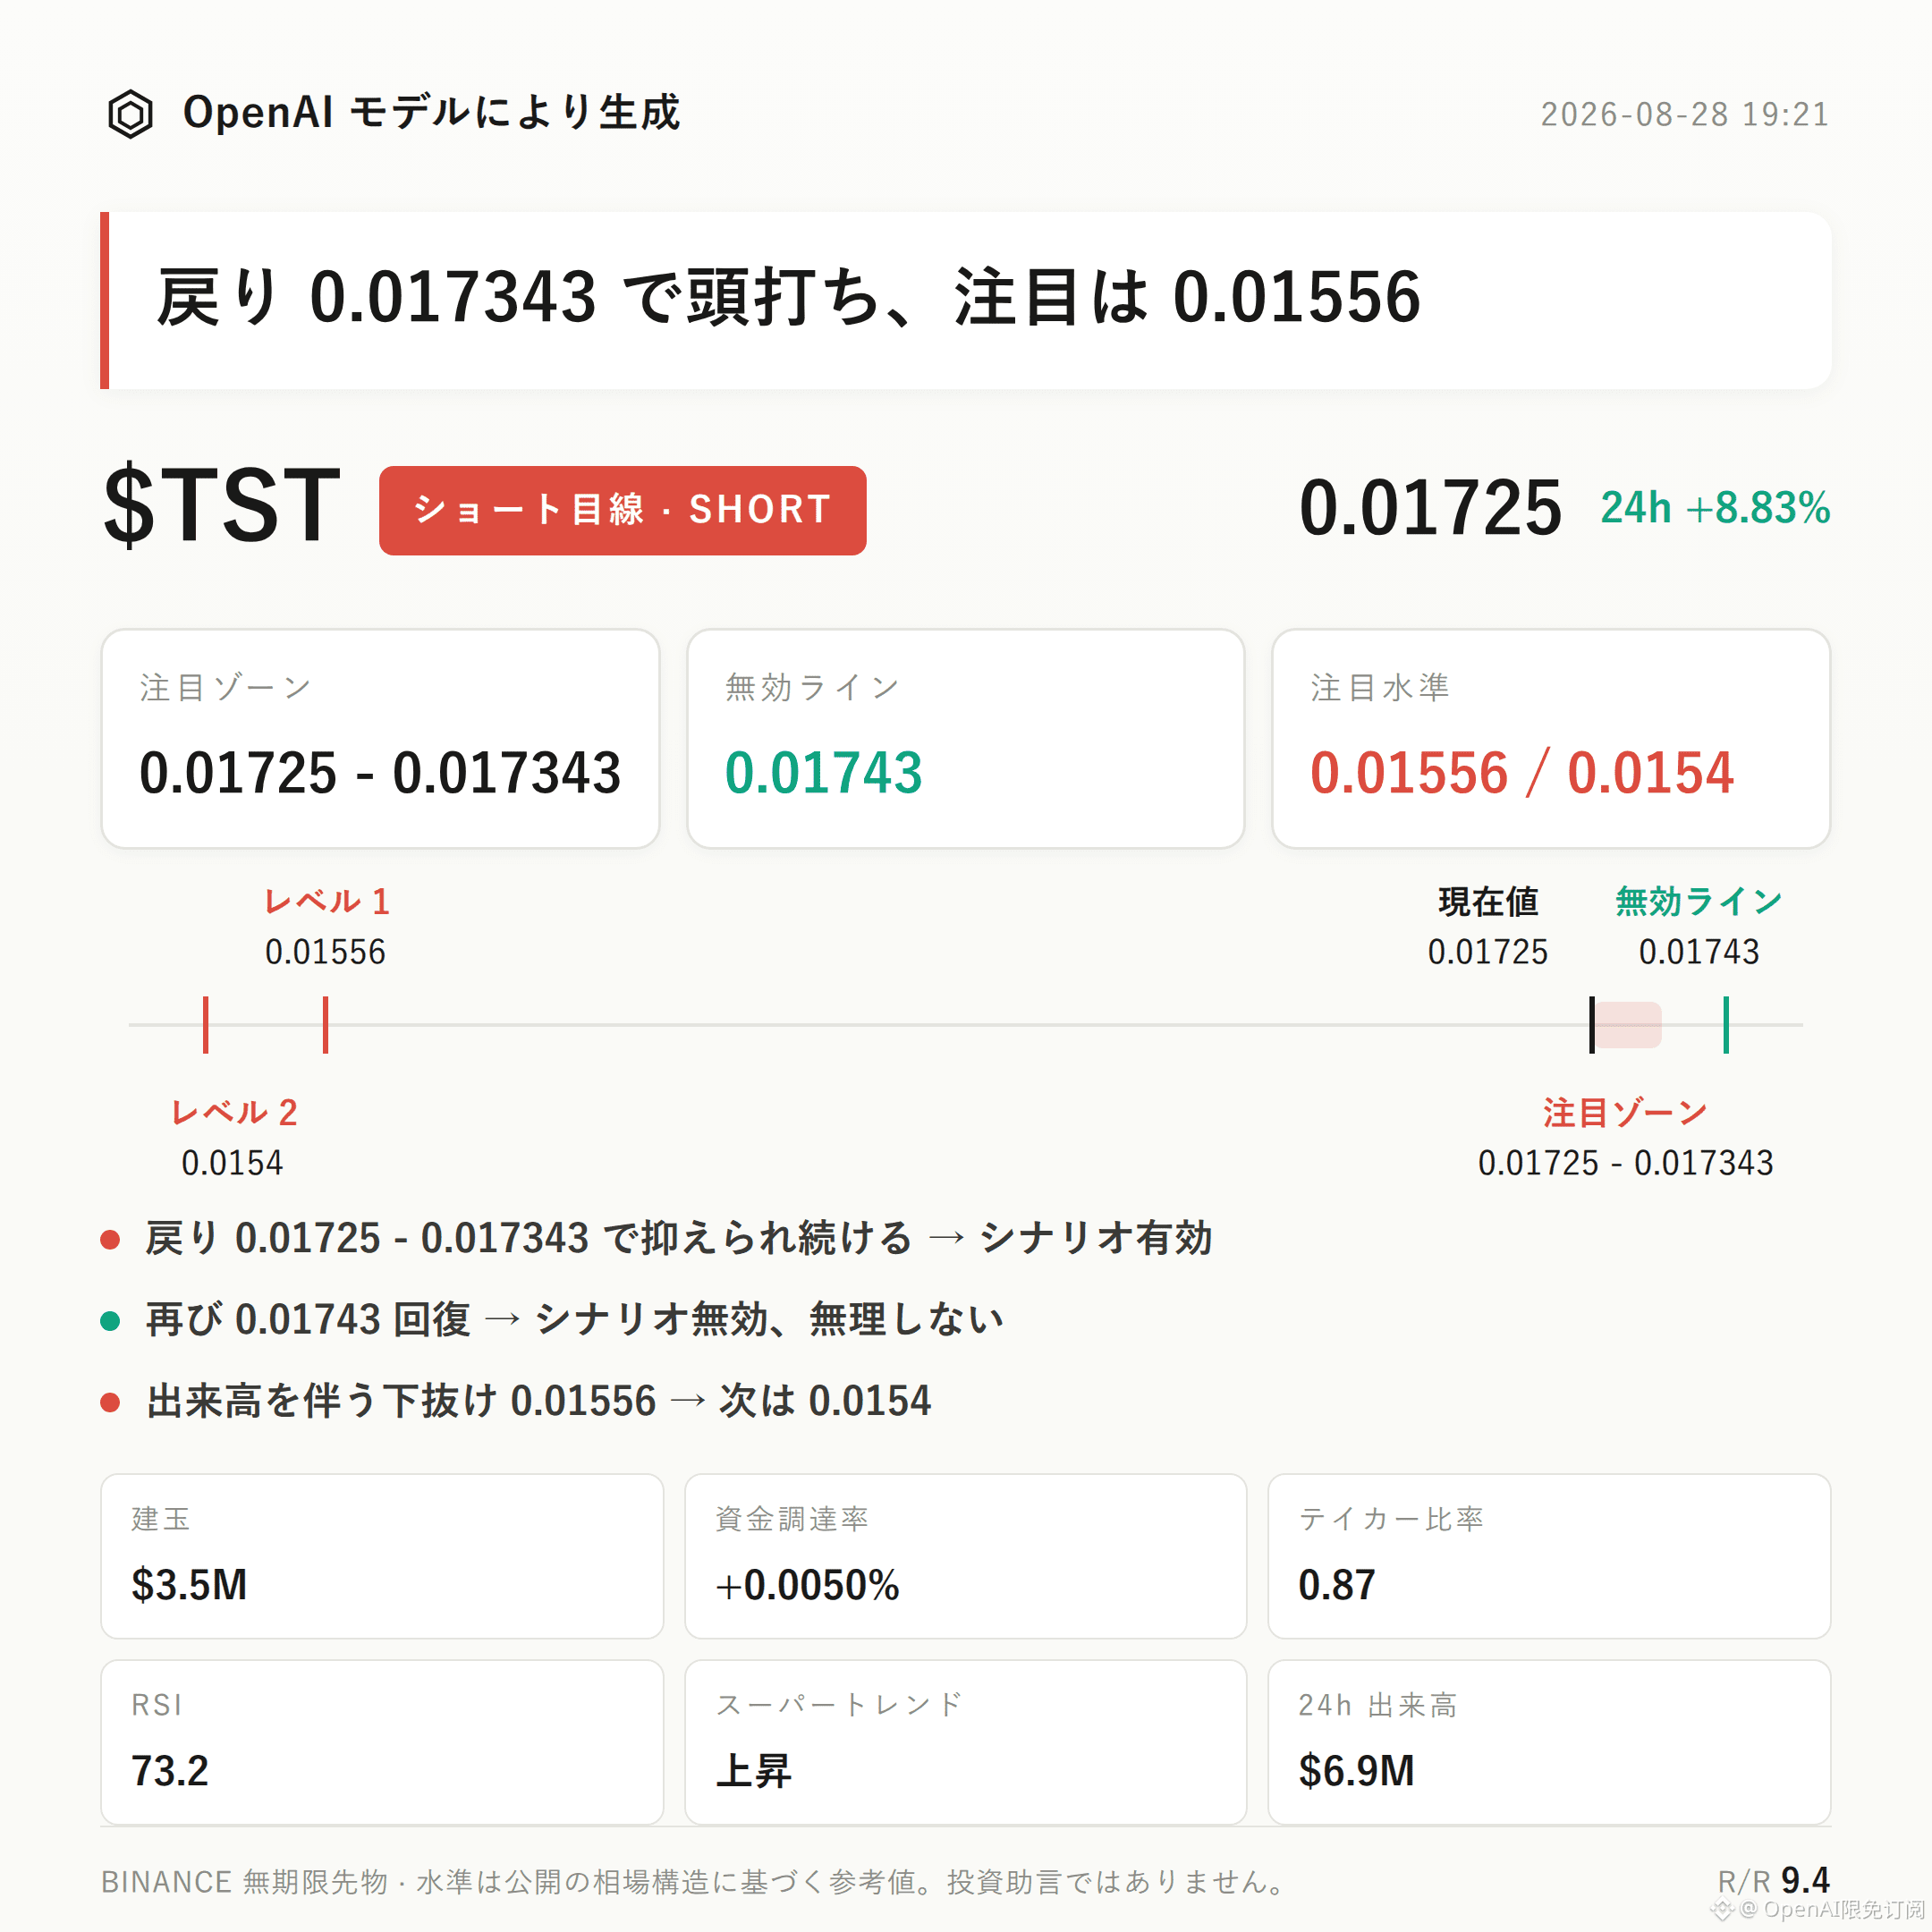
$TST bearish-leaning approach | Watch zone 0.01725 - 0.017343 | Invalidation level 0.01743 | Observation levels 0.01556 / 0.0154
The current structure for $TST is leaning bearish as it develops.
The core argument is that selling pressure on the order book is dominant (active buy/sell ratio 0.87) combined with an overbought reading from RSI at 73.2; the risk of a pullback after a short-term spike is building.
The key is whether the retracement can be capped within the watch zone—this will determine whether the pullback structure can continue.
Technically, the recent high is 0.01743, the recent low is 0.01556, and the current price 0.01725 has moved to the upper end of this range.
On the Bollinger Bands: upper band 0.0172, middle band 0.0163, lower band 0.0154. Price is running close to the upper band, and the deviation from the middle band is relatively large.
RSI is 73.2, sitting in the traditional overbought area; clear signs of short-term momentum exhaustion are evident.
It needs to be stated accurately: the MACD still shows bullish momentum, and the Super Trend indicator also maintains an upward direction— the larger trend has not turned bearish. Here, it is more like observing a structural cooldown from short-term overheating rather than judging a full trend reversal.
For derivatives data: 24h price change +8.83%, trading volume $6.91 million. Price reached a stage-high after a volume-backed surge.
Open interest is $3.51 million, with a 24h change of +19.6%. Long-chasing capital is accumulating quickly; once price weakens, it can easily trigger a chain of liquidations due to profit-taking.
Funding rate +0.0050%, long account share 59%—the leveraged structure is more tilted toward longs.
Active buy/sell ratio is 0.87, meaning active sell orders dominate. This suggests that as price pushed higher, the actual trading order-book has shown signs of seller-side pressure.
Place the reference zone at 0.01725 to 0.017343. It is more suitable to wait for a retracement to meet resistance in this area and then look for confirmation signals before deciding whether the structure holds.
If price regains and holds above 0.01743 effectively, it would indicate the current pullback structure is broken— the bearish thesis would be invalid, and you should not continue using the original approach.
If price breaks down with volume below 0.01556, you can then look toward the support around 0.0154 as the next extension area for observation.
On the risk side: both MACD bullish momentum and the Super Trend upward direction have not changed yet. What we currently see is mainly a structural pullback after short-term overheating; there are no other notable bearish reversal signals at this time, and this must be stated objectively.
With contract leverage, position discipline is more important than direction judgment.
Position note: This account holds $FOGO long positions in real trading. As long as the logic is not broken, the position will be held.
For reference only and does not constitute investment advice. Contracts involve leverage; investing is risky.
This article is generated with assistance from an OpenAI large model.
$TST #Contract analysis
$TST bearish-leaning approach | Watch zone 0.01725 - 0.017343 | Invalidation level 0.01743 | Observation levels 0.01556 / 0.0154
The current structure for $TST is leaning bearish as it develops.
The core argument is that selling pressure on the order book is dominant (active buy/sell ratio 0.87) combined with an overbought reading from RSI at 73.2; the risk of a pullback after a short-term spike is building.
The key is whether the retracement can be capped within the watch zone—this will determine whether the pullback structure can continue.
Technically, the recent high is 0.01743, the recent low is 0.01556, and the current price 0.01725 has moved to the upper end of this range.
On the Bollinger Bands: upper band 0.0172, middle band 0.0163, lower band 0.0154. Price is running close to the upper band, and the deviation from the middle band is relatively large.
RSI is 73.2, sitting in the traditional overbought area; clear signs of short-term momentum exhaustion are evident.
It needs to be stated accurately: the MACD still shows bullish momentum, and the Super Trend indicator also maintains an upward direction— the larger trend has not turned bearish. Here, it is more like observing a structural cooldown from short-term overheating rather than judging a full trend reversal.
For derivatives data: 24h price change +8.83%, trading volume $6.91 million. Price reached a stage-high after a volume-backed surge.
Open interest is $3.51 million, with a 24h change of +19.6%. Long-chasing capital is accumulating quickly; once price weakens, it can easily trigger a chain of liquidations due to profit-taking.
Funding rate +0.0050%, long account share 59%—the leveraged structure is more tilted toward longs.
Active buy/sell ratio is 0.87, meaning active sell orders dominate. This suggests that as price pushed higher, the actual trading order-book has shown signs of seller-side pressure.
Place the reference zone at 0.01725 to 0.017343. It is more suitable to wait for a retracement to meet resistance in this area and then look for confirmation signals before deciding whether the structure holds.
If price regains and holds above 0.01743 effectively, it would indicate the current pullback structure is broken— the bearish thesis would be invalid, and you should not continue using the original approach.
If price breaks down with volume below 0.01556, you can then look toward the support around 0.0154 as the next extension area for observation.
On the risk side: both MACD bullish momentum and the Super Trend upward direction have not changed yet. What we currently see is mainly a structural pullback after short-term overheating; there are no other notable bearish reversal signals at this time, and this must be stated objectively.
With contract leverage, position discipline is more important than direction judgment.
Position note: This account holds $FOGO long positions in real trading. As long as the logic is not broken, the position will be held.
For reference only and does not constitute investment advice. Contracts involve leverage; investing is risky.
This article is generated with assistance from an OpenAI large model.
$TST #Contract analysis