$GWEI
Breakout occurs with strong volume, but chasing the current price is not an ideal move. What matters now is whether the breakout zone can hold up during the retest.
Entry Zone: 0.02431 – 0.02434
Stop Loss: 0.02333
TP1: 0.02701
Sustained holding above the retest zone can support further upside.
The setup is invalid if $GWEI closes below 0.02333 on the 1-hour timeframe.#NVIDIAEarnings
💫 NVIDIA Corporation (NVDA) once again reported earnings that were better than expected yesterday after the market closed, and although it briefly saw a sell-off early on, the stock rose +6% in overnight trading.
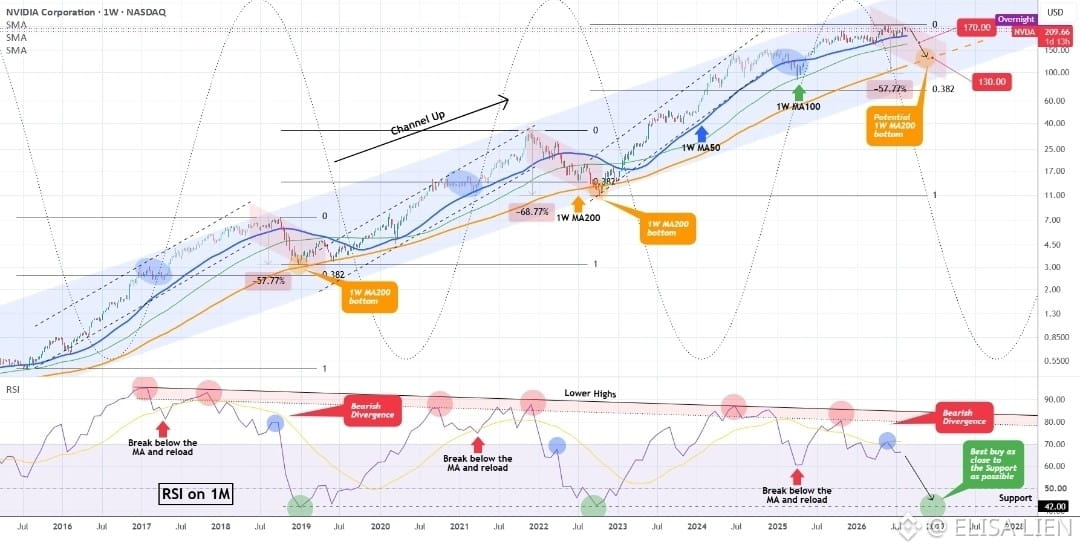
However, regardless of the current euphoria, the company has followed a very specific technical dynamic that marks long-term Peaks and Troughs within a 11-year Up Channel (since July 2015).
These sharply different characteristics show a very cyclical Leg (both Bullish and Bearish), with strong symmetry between the two. Based on the Sinus Wave, we can see that after the Cycle Peaks of 2018 and 2022, it is now 2026’s turn to form a Cycle peak and start the long-term correction (Bearish Leg); technically, a Bearish Cycle should form a Trough at the end of the year (2026).
Based on this pattern, we believe the Cycle Peak has already been reflected in price at the All Time High (ATH) on May 14, 2026. The sideways market activity since then could be evidence, due to the lack of stronger liquidity to push the stock price higher.
.
$NVDA
Breakout occurs with strong volume, but chasing the current price is not an ideal move. What matters now is whether the breakout zone can hold up during the retest.
Entry Zone: 0.02431 – 0.02434
Stop Loss: 0.02333
TP1: 0.02701
Sustained holding above the retest zone can support further upside.
The setup is invalid if $GWEI closes below 0.02333 on the 1-hour timeframe.#NVIDIAEarnings
💫 NVIDIA Corporation (NVDA) once again reported earnings that were better than expected yesterday after the market closed, and although it briefly saw a sell-off early on, the stock rose +6% in overnight trading.
However, regardless of the current euphoria, the company has followed a very specific technical dynamic that marks long-term Peaks and Troughs within a 11-year Up Channel (since July 2015).
These sharply different characteristics show a very cyclical Leg (both Bullish and Bearish), with strong symmetry between the two. Based on the Sinus Wave, we can see that after the Cycle Peaks of 2018 and 2022, it is now 2026’s turn to form a Cycle peak and start the long-term correction (Bearish Leg); technically, a Bearish Cycle should form a Trough at the end of the year (2026).
Based on this pattern, we believe the Cycle Peak has already been reflected in price at the All Time High (ATH) on May 14, 2026. The sideways market activity since then could be evidence, due to the lack of stronger liquidity to push the stock price higher.
.
$NVDA