
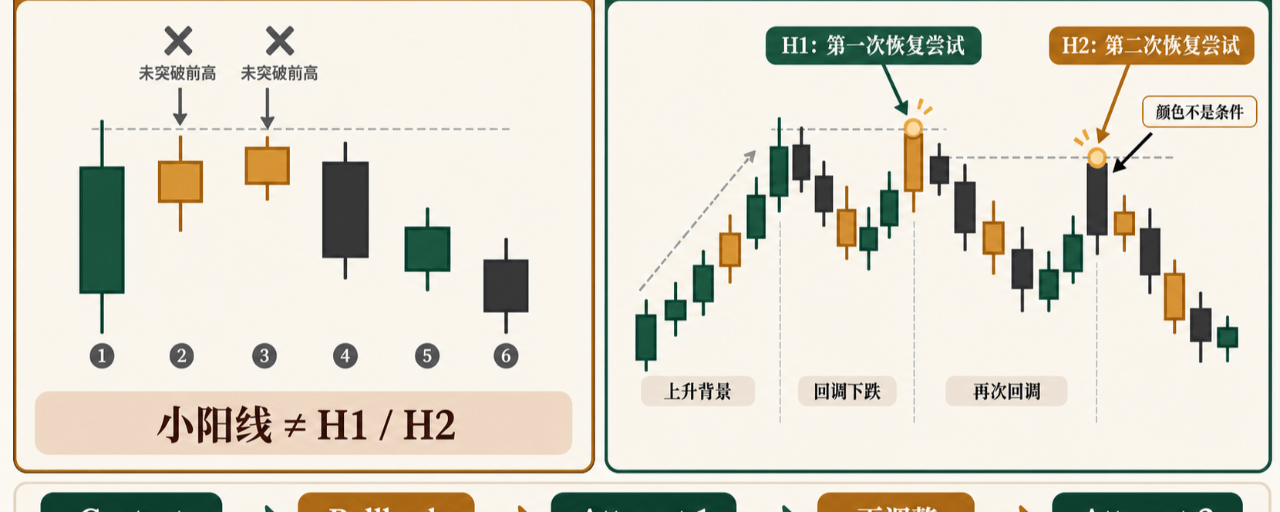

When organizing the terminology of the first lesson of the “Price Action Chinese Learning Site,” we found a very typical problem: many people, the first time they see High 1 and High 2, instinctively translate them as “the first bullish candle, the second bullish candle.”
This misconception clearly shows why price action needs a complete Chinese learning path—not just a bilingual terminology list. Next, using full definitions, background, resets, failure cases, and exercises, we will demonstrate how to turn “you’ve seen H1/H2” into “you can explain H1/H2 candle-by-candle.”
1. The most common misunderstanding: seeing a bullish candle and starting to count right away
There are usually three kinds of misunderstandings.
First, mark the first bullish candle in the pullback as High 1, and the second bullish candle as High 2. This completely ignores whether the candlestick truly breaks above the prior high. Two consecutive bullish candles may both be contained within the range of the previous candlestick, or they may just be noise in the middle of a range.
Second, as long as two lows appear on the chart, you assume the second low is High 2. A double bottom can indeed appear at the same time as High 2, but “looking like a double bottom” doesn’t mean the trend has recovered and there has already been a second attempt.
Third, treat High 2 as an automatic buy instruction. Labels only tell us that the count has reached the second time; they don’t indicate that the background is necessarily favorable, nor do they guarantee that there will be continuation after the trigger.
II. Correct definition: it counts recovery attempts, not the color of candles
After a bull trend (bullish trend) or a strong upward breakout that is still valid, price shows a sideways-to-down pullback.
In this pullback, the market’s first attempt to recover the uptrend is called High 1. The first attempt doesn’t go far, price returns to the adjustment state, and then a second attempt to recover the uptrend appears—this is called High 2.
When observing candle by candle, a common way to land it is: check whether the current candle’s high breaks above the previous candle’s high. The first valid upward attempt is recorded as H1; if it fails or lacks follow-through, the pullback continues, and the later second upward attempt is recorded as H2.
There are two key points here.
First, a candlestick that breaks above the previous high can still close bearish, because whether the high breaks is one thing and whether the close is above the open is another. Conversely, if a bullish candle doesn’t form a new upward attempt, it shouldn’t be counted just because of its color.
Second, H1/H2 are structural labels, not trade outcomes. If you use an observation method triggered by breaking above a high, you still need to distinguish the Setup (pattern conditions), the Signal Bar (signal candle), the Entry Bar (the candle where the actual trigger occurs), and the subsequent Follow-through (continuation).
III. Counting logic: first set the starting point, then count the attempts
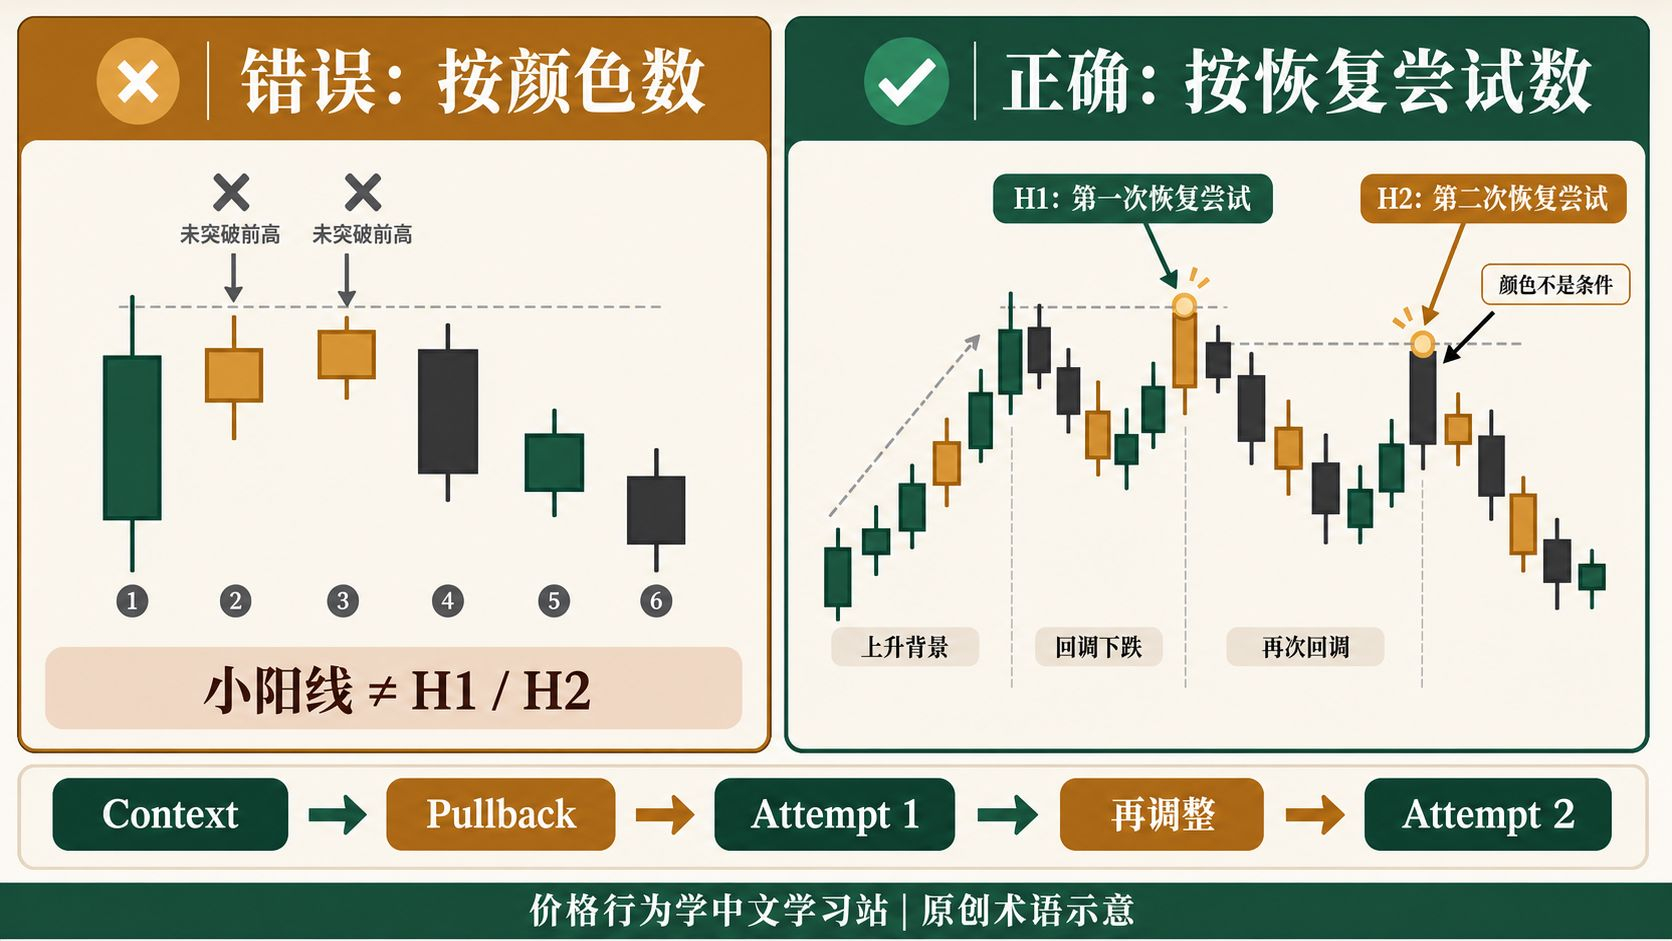
You can break the counting into five steps:
First confirm that there is a bullish background on the left side, rather than starting to count from any arbitrary candle.
Find the pullback starting point after the up move, and clarify which adjustment level you are currently observing.
Look candle by candle to the right; if there is no new upward recovery attempt, don’t increase the number.
Record the first attempt as H1. If it obviously recovers the trend, the original pullback may already be over; if it stalls quickly and then turns down again or moves sideways, continue observing.
The second recovery attempt within the same pullback is recorded as H2. It often appears alongside two phases of correction, an ABC Pullback, or a double-bottom bull flag, but these appearances are not hard requirements.
The core of this logic is “change of state”:
Uptrend background → pullback → first recovery → pullback again → second recovery.
Counting candles only by color will compress the whole process into a static screenshot.
Even on the same chart, a large pullback and an internal small pullback may exist simultaneously. Two observers may end up with different counts because they choose different levels to observe. As long as each person explains their counting starting point, the observation level, and the basis for reset, different labels don’t necessarily mean someone “drew it wrong.”
IV. Why Context matters more than labels
For the same H2, if it’s placed in different locations, its meaning can be completely different.
If the left side shows a clear bullish advance, the overlap in the pullback increases while the strength is mild, and there is structural support below such as a prior breakout level, then the second recovery attempt should be at least consistent with the original trend direction.
If it appears just below major-timeframe resistance, after a climax at the end of a trend, or after the market has already entered a Trading Range, the continuation space and reliability of the same H2 will decrease.
Therefore, the observation order should be:
Context → Setup → Signal Bar → whether it triggers → whether it follows through → whether the risk is acceptable.
High 2 only occupies one slot. It can’t replace judging the trend, judging position, and it certainly can’t replace a trade’s position sizing and exit plan.
V. When to reset the count?
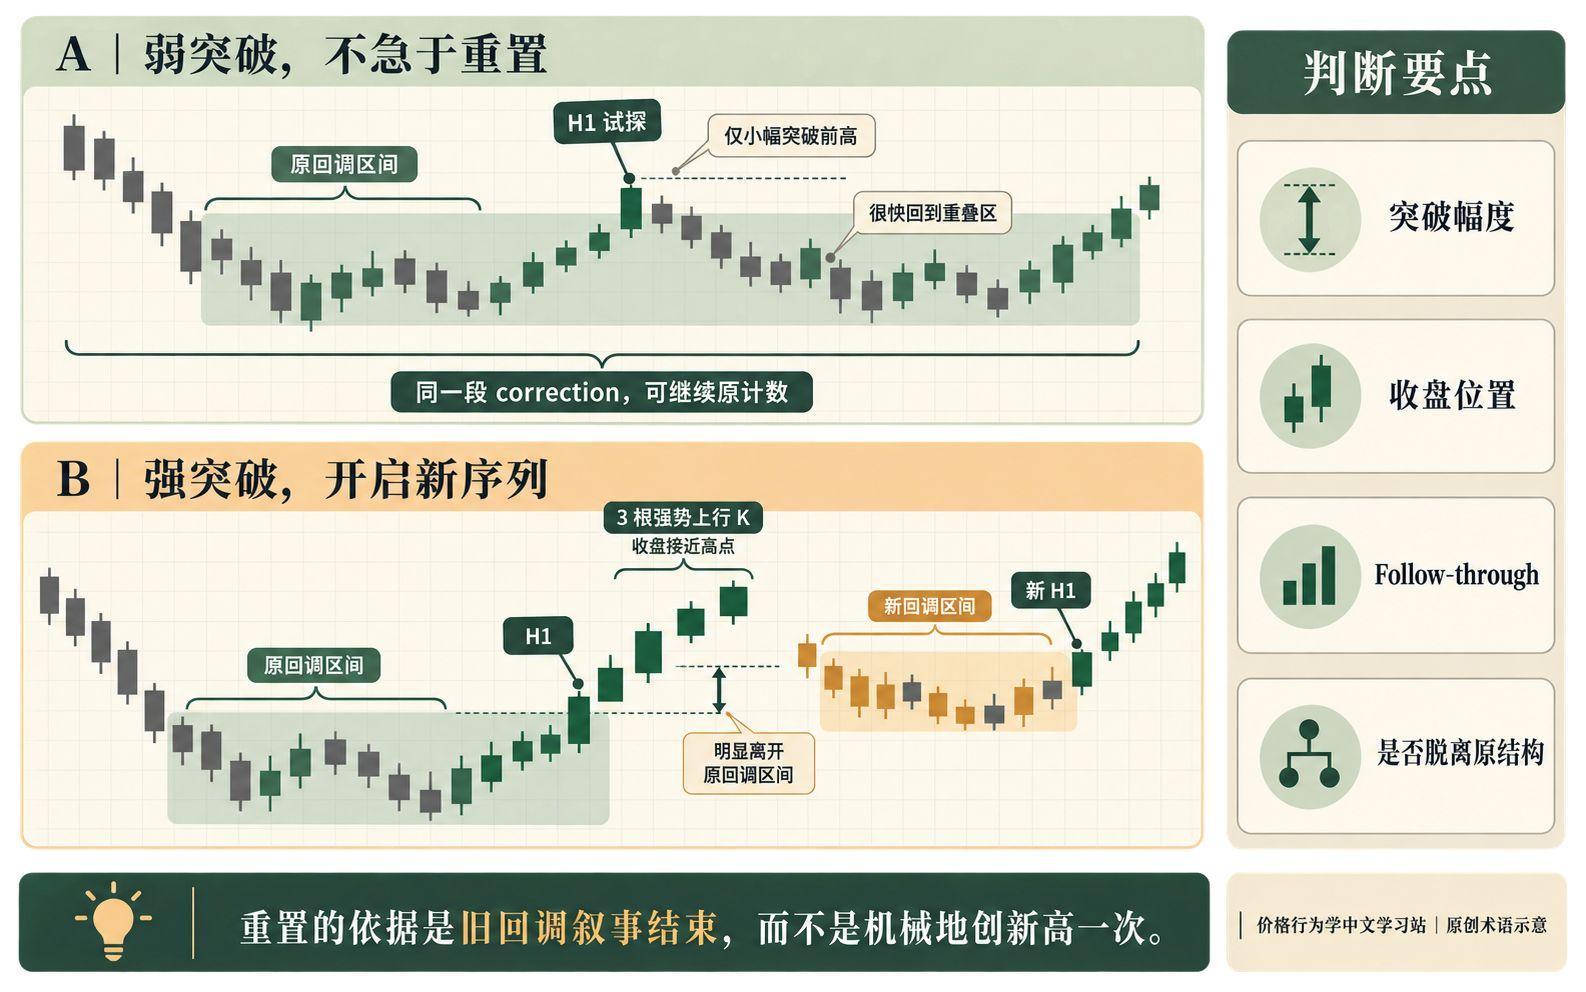
A reset isn’t “price slightly makes a new high so the count automatically goes to zero”; it’s that the original pullback narrative has already ended.
The most typical scenario is: a recovery attempt develops into a sufficiently strong new bull breakout, with clear follow-through and the market forming a new upward leg. After that, if a new pullback appears again, start counting anew from the new H1 on H1.
On the contrary, if the so-called breakout only moved a bit and quickly returned to the original overlapping zone, you can still treat the subsequent movement as part of the same correction and continue the original count.
There is no fixed numeric threshold that applies to all charts. Breakout magnitude, closing position, continuity, and the location it’s occurring in must all be judged together.
Two other situations are more suitable for “stopping the count”: one is when a strong downward breakout has already destroyed the original bullish premise; the other is when a long period of sideways movement blurs the clear boundaries of the original pullback level.
Instead of debating whether a particular candle is H2 or H3, it’s better to reassess the market state.
VI. Two original examples
Example 1: Even a bearish candle may participate in forming the second upward attempt
Assume there is a stable uptrend on the left side, followed by a pullback.
Overall, the first to third pullback candles shift lower; although the second one closes bullish, its high is still below the previous candle’s high—so you can’t call it H1 just because of its color.
On the 4th candle, it breaks above the high of the 3rd candle, forming the first recovery attempt; price only pushes a short distance, and then the next two candles probe down again.
The 7th intraday candle breaks above the high of the 6th candle but closes below the opening price. Although it’s a bearish candle, within the counting of this pullback it can still form the second upward recovery attempt.
This example shows: color answers “how this candle closes,” while H1/H2 answers “which attempt number this is to recover the original trend.”
Example 2: After a strong breakout, the old H1 should not be carried into the new pullback
Assume that after a single H1, three relatively large-bodied bullish candles appear, with closes consecutively approaching their respective highs. Price clearly moves away from the original pullback area and makes a new high. Then the market begins a completely new shallow pullback.
At this point, the more reasonable label for the first time price again breaks above the prior high is a new sequence’s H1, not reusing the old pullback and calling it H2.
The reason isn’t “three candles were in between.” It’s that the strong breakout and follow-through have already ended the old correction, and a new breakout—pullback sequence has been established.
VII. Common failure situations for High 2
High 2 can still fail, especially be alert to the following background:
The original bullish trend has been destroyed by a strong bear breakout;
The pattern is located in the middle of a Trading Range, where two-way trading dominates;
Resistance is very close overhead, so usable space is very small;
After H2 triggers, there is no bull follow-through; price immediately returns to the signal zone.
The signal candle is too large; a reasonable protective distance implies a risk that isn’t acceptable in reality.
The count comes from too small a local structure, while ignoring that the larger timeframe is still in a downswing.
Failure doesn’t necessarily mean the label is definitely wrong. Correctly identifying an H2 can still lead to a failure outcome; price action provides a probabilistic framework, not a guarantee of results.
VIII. Why do we include this in the Chinese-learning site?
Scattered answers usually stop at a “one-sentence definition.” Real learning requires putting the terminology back into context, then re-checking identification, application, and invalidation.
That’s why the Chinese-learning site for price action connects English terminology, common misconceptions, structured chapters, original case studies, and practice questions into a single path—and also provides terminology search, review quizzes, and learning progress tracking.
It’s not a price-action forecasting or signal service; the goal is to let the concepts you’ve learned be retold, verified, and reviewed.
IX. Practice questions
In a pullback within a bull trend, two bullish candles appear consecutively, but neither candle’s high breaks above its respective previous high. Are they H1 and H2? Why?
After H1, a strong bullish breakout and continuous follow-through appear, and then a new pullback forms. How should the first recovery attempt in the new pullback be counted?
For the same H2: one is at the end of a mild pullback within a clear bull trend, and the other is in the middle of a wide Trading Range. What Context differences will you check?
Find a historical chart and cover up the candle-by-candle playback on the right side. Every time you mark H1/H2, write down at the same time: the counting starting point, whether it triggered, whether there was follow-through, and what evidence would make you reset or abandon the count.
Reference idea:
Question 1 can’t be counted just by bullish candles; Question 2 usually starts a new sequence; Question 3 at least compares trend, location, resistance, space, and follow-through; the focus of Question 4 isn’t to draw the label as “the only correct one,” but to make the basis for judgment something you can re-check.
X. Summary
The numbers for High 1 / High 2 count the number of recovery attempts in the same bullish pullback, not the order that bullish candles appear.
To use them correctly, you first need to confirm the bull trend and the pullback, then determine whether the first attempt failed, whether the second attempt still belongs to the same correction segment, and whether there is a strong enough new breakout in between that warrants a reset.
Remember one sentence is enough:
Read the left-side context first, then count the recovery attempts; first check whether there is follow-through, then discuss the value of the label.
If what you need isn’t more fragmented answers, but a learning path you can search, review, do questions with, and record progress—feel free to DM me “learning site” to get the functional explanation and experience method of the Chinese price-action learning site.
Also feel free to write in the comments three items in advance: your H1/H2 counting starting point, the basis for reset, and the candle that’s hardest to judge. We’ll keep turning frequent questions into original terminology lessons and exercises.
This site is an independently made learning tool. It does not represent any official position of any third-party course, instructor, or institution, nor does it claim to have obtained their authorization.
Education and risk disclaimer: This article is only for learning price-action terminology and chart observation practice. It does not constitute investment advice, stock recommendations, signal calling, or any promise of returns. Any pattern can fail; real trading is also affected by commissions, slippage, liquidity, leverage, data-source differences, and instrument rules. Please make independent judgments and only simulate, replay, or make decisions on the premise of risks you can bear.