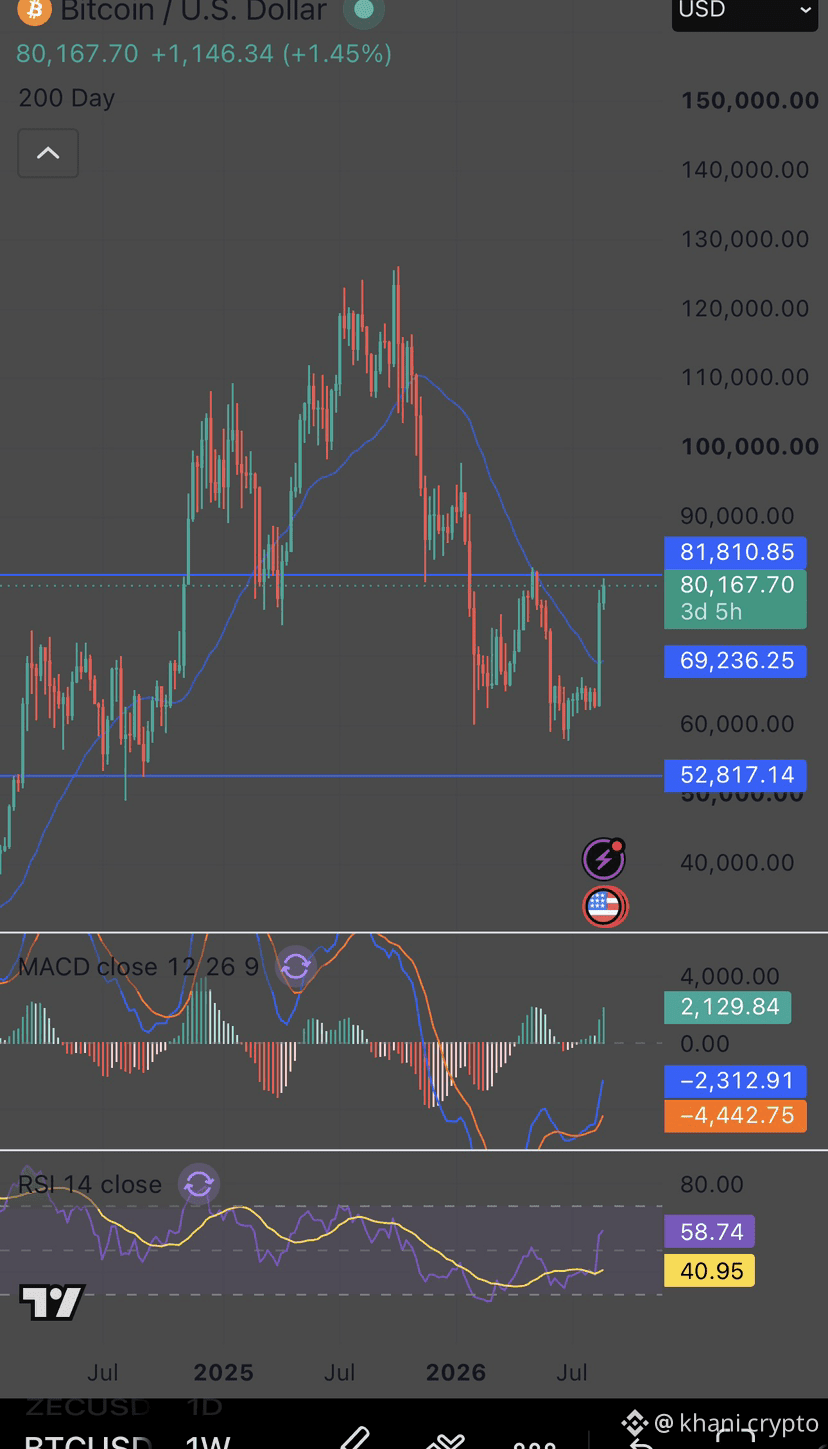
$BTC It surged strongly from the 50k levels to $80,000, and most people think the hardest part is already over.
But the chart says the real test starts now. 👀
Price isn’t moving in an open range—it’s directly hitting the $81,770 level, the same line that rejected every attempt to go up since May.
And more importantly, price reached this area the wrong way.
It wasn’t a gradual, healthy climb—it was a near-vertical rebound from 62K to 80K within weeks.
This isn’t just an uptrend…
This is Mean Reversion at full speed toward a resistance wall.
📊 RSI at 82
This isn’t strength you should chase—it’s more like a spring pulled to the maximum.
When the daily RSI breaks above 80 alongside a known resistance, this is often the zone where selling begins—not where late buyers get the advantage.
So everything now boils down to one number:
🎯 $81,770
🟢 Bullish scenario
• Reclaim $81,770
• A clear close above it
• Retest from above and success in holding it
• Keeping the higher low at 58K intact
If that happens, then 90K will become the next magnet. 🚀
🔴 Bearish scenario
Price stalls and forms a lower high, while RSI starts dropping and price is unable to move forward.
This would be a classic Bearish Divergence, and price may return to fully test the previous range.
The whole story—was and still is—about this line. �
But the chart says the real test starts now. 👀
Price isn’t moving in an open range—it’s directly hitting the $81,770 level, the same line that rejected every attempt to go up since May.
And more importantly, price reached this area the wrong way.
It wasn’t a gradual, healthy climb—it was a near-vertical rebound from 62K to 80K within weeks.
This isn’t just an uptrend…
This is Mean Reversion at full speed toward a resistance wall.
📊 RSI at 82
This isn’t strength you should chase—it’s more like a spring pulled to the maximum.
When the daily RSI breaks above 80 alongside a known resistance, this is often the zone where selling begins—not where late buyers get the advantage.
So everything now boils down to one number:
🎯 $81,770
🟢 Bullish scenario
• Reclaim $81,770
• A clear close above it
• Retest from above and success in holding it
• Keeping the higher low at 58K intact
If that happens, then 90K will become the next magnet. 🚀
🔴 Bearish scenario
Price stalls and forms a lower high, while RSI starts dropping and price is unable to move forward.
This would be a classic Bearish Divergence, and price may return to fully test the previous range.
The whole story—was and still is—about this line. �