
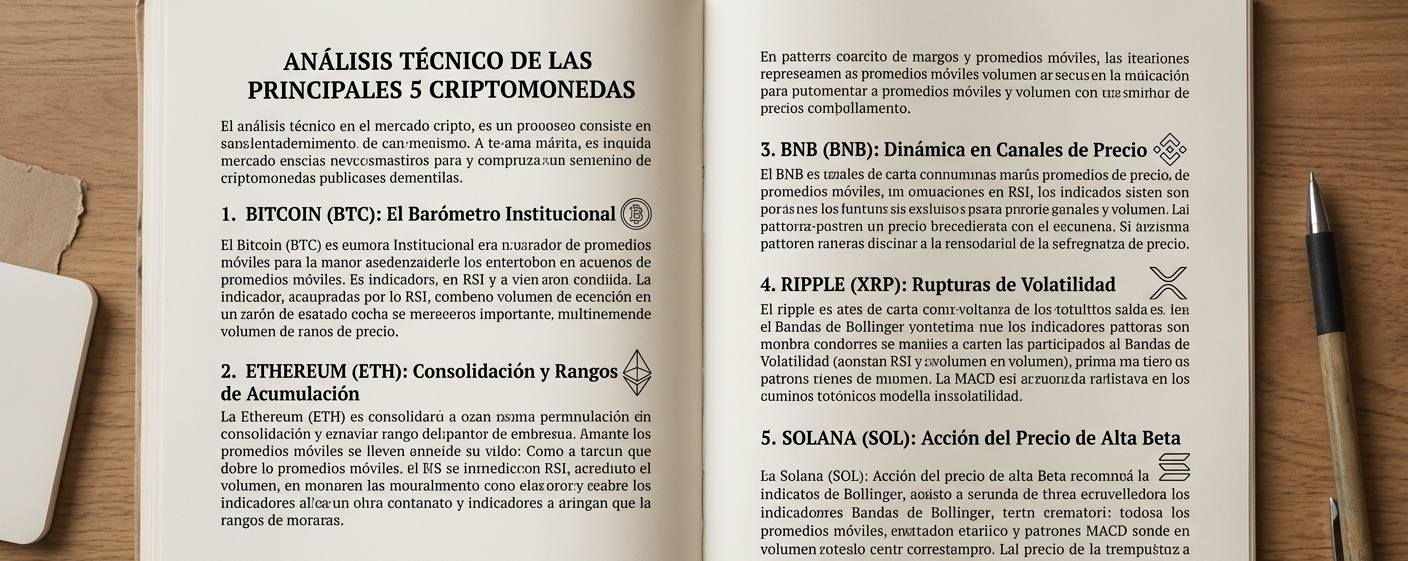

Technical analysis in the cryptocurrency market combines reading price action, chartist patterns, and quantitative indicators to anticipate supply and demand movements. Excluding stablecoins (such as USDT) due to their fixed parity, the most capitalized assets that lead this discipline are Bitcoin (BTC), Ethereum (ETH), BNB, Ripple (XRP), and Solana (SOL).
Technical Behavior of the Leading Assets
1. Bitcoin (BTC): The Institutional Barometer
Bitcoin sets the macro trend of the ecosystem. From a technical perspective, BTC stands out for:
Long-Term Moving Averages: The 50- and 200-day exponential moving averages (EMAs) act as structural support in bullish cycles. A crossover of these lines often signals macro trend changes.
Psychological Levels and Fibonacci Retracements: The main resistance and support zones respond with high precision to Fibonacci extensions and retracements (38.2%, 50%, and 61.8%).
2 Ethereum (ETH): Consolidation and Accumulation Ranges
Ethereum reflects the liquidity of the decentralized finance (DeFi) sector:
Trend Lines and Continuation Patterns: ETH often forms flag patterns and symmetrical triangles during its consolidation phases.
Relative Strength Index (RSI): Bullish or bearish divergences between the price of ETH and the RSI on daily (1D) timeframes provide key signals of exhaustion in buying or selling pressure.
3. BNB (BNB): Price Channel Dynamics
As a native token of the BNB Chain network, it shows technical behavior influenced by usage cycles and ecosystem events:
4. Ripple (XRP): Volatility Breakouts
XRP is characterized by prolonged periods of sideways consolidation followed by strong impulses:
5. Solana (SOL): High-Beta Price Action
Solana stands out for its high volatility and dynamism in short- and medium-term movements:
Breakdown Structure and Retest (Break & Retest): SOL responds precisely to the validation of former resistances turned into supports.
MACD (Moving Average Convergence/Divergence): The MACD line crossing above the signal line on 4-hour and 1-day timeframes is widely used to confirm the strength of the impulse in emerging trends.
Summary of Key Technical Indicators
Cryptocurrency Frequent Chart Pattern
Primary Indicator Main FunctionBitcoin
(BTC)Ascending Triangles / Macro Channels 50 EMA / 200 EMA Macro Trend Confirmation
Ethereum (ETH)Continuations Flags
RSI (14 periods)Overbought / Oversold Detection
BNB (BNB) Accumulation Ranges
Ripple (XRP) Wedge Compression Bollinger Bands Volatility Measurement and Breakouts
Solana (SOL) Break and Retest of Levels
Technical analysis provides a probabilistic framework to manage risk through clear invalidation levels (stop-loss) and take-profit points. However, in the crypto market, it must always be combined with volume readings, on-chain data, and capital risk management.
#ChinaOpposesUSProposed7.5%Tariff
#KospiClosesAtRecordHigh #OktaCrowdStrikeSurgeOnEarningsBeat #BestBuyQ2RevenueTopsEstimatesLiftsOutlook