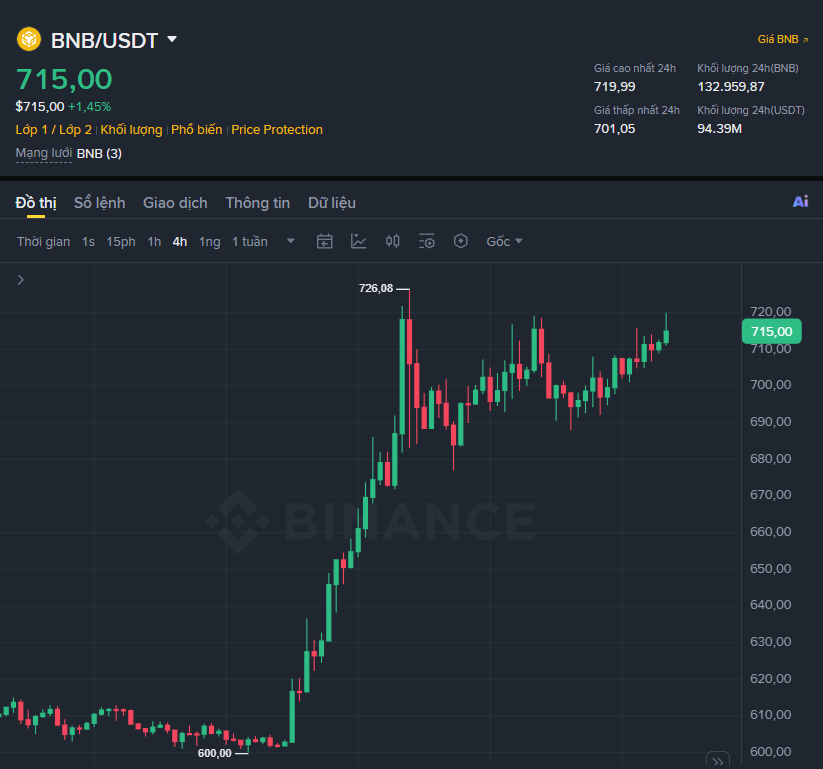

🔥 $BNB LONG — BREAKOUT 4H IS GETTING ACTIVATED?
While most people are still focused on Bitcoin, I’m paying close attention to $BNB .
A 4H chart just appeared with a structure-breaking signal: the price has broken above local highs and is starting to show proactive buying pressure. To me, this is a more notable point than a normal pullback.
🟢 $BNB/USDT — LONG | Confidence: 72%
📌 Entry: 715.659 – 716.521
🛑 SL: 707.428
🎯 TP1: 722.586
🎯 TP2: 726.917
🎯 TP3: 733.414
What I care about most is the RSI on the 15M timeframe around 72.98, indicating fairly strong upward momentum. However, high RSI also means you shouldn’t FOMO and chase the price—waiting for a retest into the entry zone will be safer.
The Daily timeframe is still leaning sideways, so the biggest question right now is:
👉 Is this breakout truly going to extend the trend, or is it just a false breakout before $BNB goes back into the range?
For me, 707.428 is a very clear line. If the structure holds above that level, I’ll keep tracking the possibility of BNB moving toward the TP zones.
⚠️ Manage your capital tightly: don’t go all-in, and don’t turn a nice setup into an overly risky trade just because of FOMO.
Do you think it’s a BREAKOUT or a FALSE BREAKOUT? 👇
While most people are still focused on Bitcoin, I’m paying close attention to $BNB .
A 4H chart just appeared with a structure-breaking signal: the price has broken above local highs and is starting to show proactive buying pressure. To me, this is a more notable point than a normal pullback.
🟢 $BNB/USDT — LONG | Confidence: 72%
📌 Entry: 715.659 – 716.521
🛑 SL: 707.428
🎯 TP1: 722.586
🎯 TP2: 726.917
🎯 TP3: 733.414
What I care about most is the RSI on the 15M timeframe around 72.98, indicating fairly strong upward momentum. However, high RSI also means you shouldn’t FOMO and chase the price—waiting for a retest into the entry zone will be safer.
The Daily timeframe is still leaning sideways, so the biggest question right now is:
👉 Is this breakout truly going to extend the trend, or is it just a false breakout before $BNB goes back into the range?
For me, 707.428 is a very clear line. If the structure holds above that level, I’ll keep tracking the possibility of BNB moving toward the TP zones.
⚠️ Manage your capital tightly: don’t go all-in, and don’t turn a nice setup into an overly risky trade just because of FOMO.
Do you think it’s a BREAKOUT or a FALSE BREAKOUT? 👇