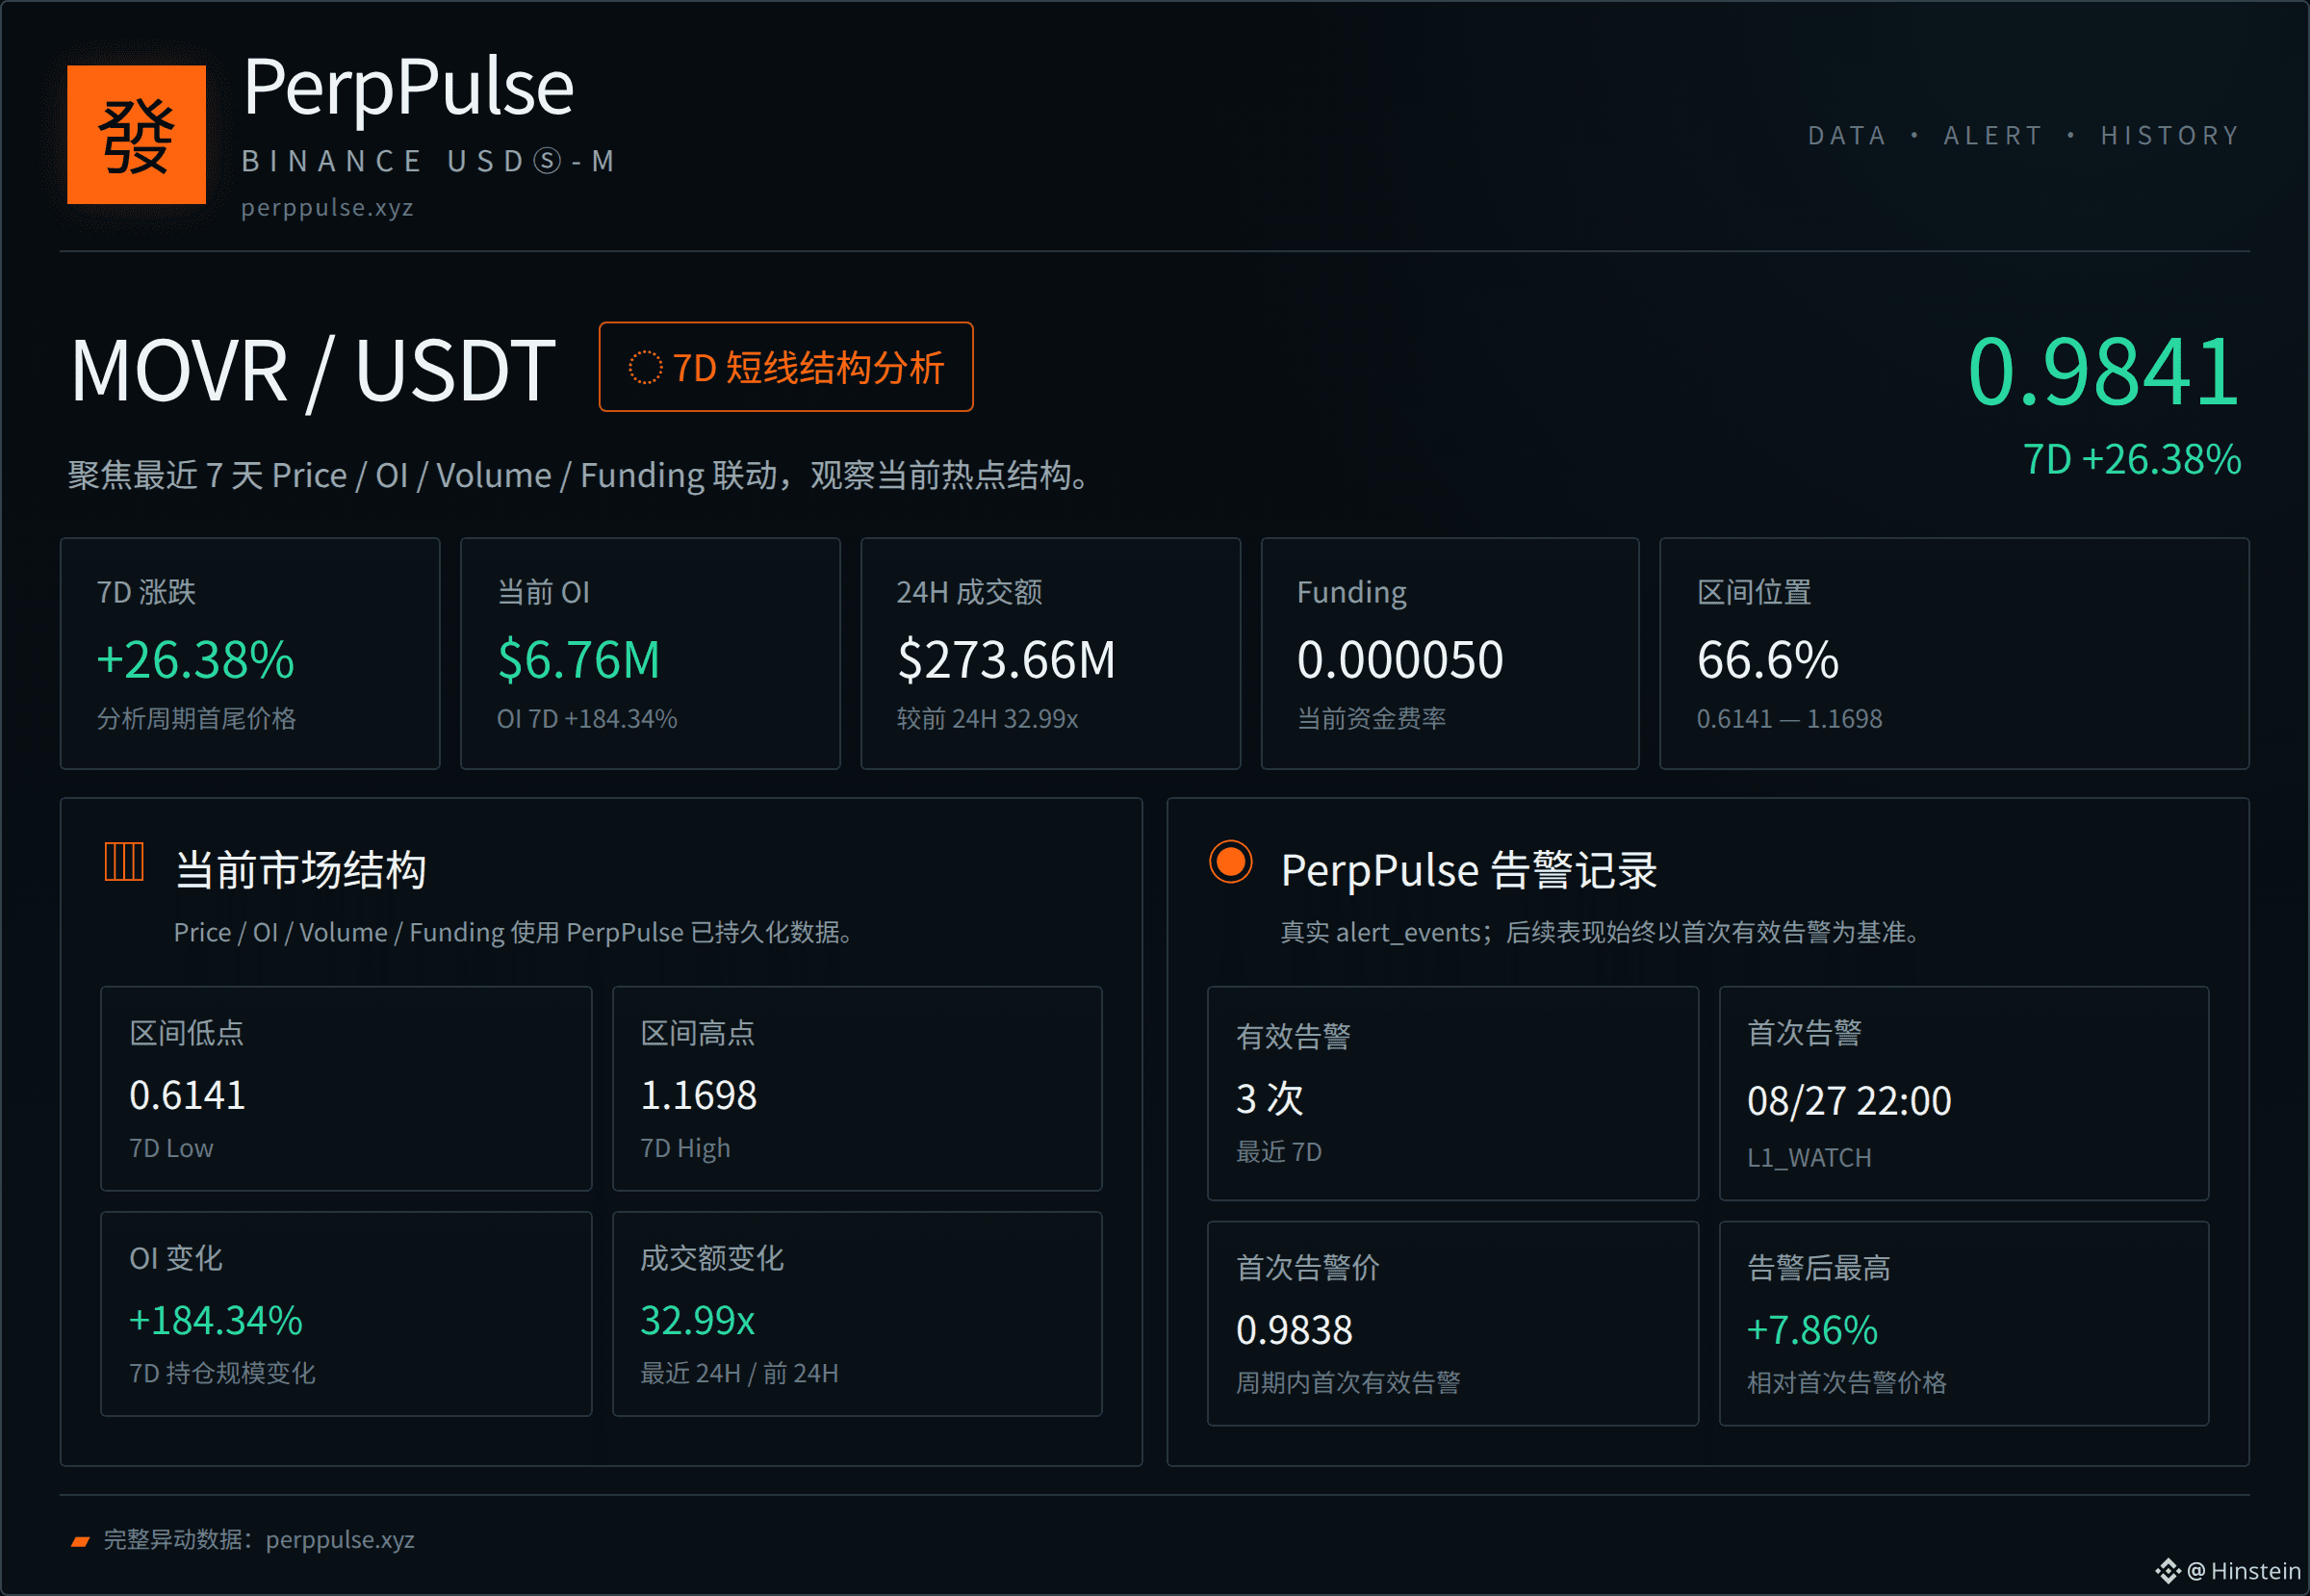
MOVR suddenly became the focus of the market this week. $MOVR climbed from 0.7787 to 0.9841 in a straight run, with a 7-day gain of 26.38%. What really draws attention is the high-volume candlestick in the early hours of August 27: the single-candle trading value surged directly to 89.15M, completely dwarfing the previous daily turnover levels that were only in the millions.
Looking back at this week’s pace, on August 22 it first poked down to the 0.6141 low, and over the following days it ground back and forth between 0.68 and 0.72 while keeping volume suppressed. Only on August 26 did things start to move: trading value expanded from 899.51K to 2.65M, and the price gradually crawled up to around 0.74. The real acceleration hit on August 27—in the early hours, that single candlestick pulled the price from 0.70 to 0.82. Then within the next four hours it surged again to 1.1698. Price swings were extremely violent intraday, with both longs and shorts fighting hard at that level.
This rally isn’t just a price anomaly; real capital is flowing in. Open interest rose from 2.24M to 6.76M, a 184.34% increase, indicating that many new positions were established in a concentrated way on August 27. 24-hour trading value reached 273.66M—up from the previous day’s 8.30M by 32.99x—showing a very high degree of volume participation. However, the funding rate is currently only 0.005%. While it is mildly bullish, it’s not crowded. Even during August 27, it briefly turned negative intraday, suggesting chase-the-rally sentiment hasn’t spiraled out of control.
PerpPulse recorded an L1_WATCH alert at 14:00 on August 27. At that time the price was 0.9838, and later at 20:00 it was upgraded to L2_PERSISTENT, with the price at 0.9787. In this period, the highest price touched 1.0611, for a maximum return of 7.86% after the first alert. Judging from how the data evolved, after the alert OI continued to climb from 5.70M to 6.76M, and volume also stayed elevated. The market structure is indeed moving in a strong direction.
The current position is at the 66.6% percentile within the 7-day range. The nearest overhead pressure is the rebound high at 1.0611. Above that is the extreme end of the range at 1.1698. On the downside, first support to watch is in the 0.9238–0.9350 area. If price breaks below that, 0.8618 becomes the next observation level. Going forward, watch whether volume can continue to stay high, whether OI is still increasing (adding positions), and whether price can hold above 0.98. If there’s a breakdown with heavy volume below 0.9238, the short-term weakening signal would be fairly clear.
Full anomaly data: perppulse.xyz
Looking back at this week’s pace, on August 22 it first poked down to the 0.6141 low, and over the following days it ground back and forth between 0.68 and 0.72 while keeping volume suppressed. Only on August 26 did things start to move: trading value expanded from 899.51K to 2.65M, and the price gradually crawled up to around 0.74. The real acceleration hit on August 27—in the early hours, that single candlestick pulled the price from 0.70 to 0.82. Then within the next four hours it surged again to 1.1698. Price swings were extremely violent intraday, with both longs and shorts fighting hard at that level.
This rally isn’t just a price anomaly; real capital is flowing in. Open interest rose from 2.24M to 6.76M, a 184.34% increase, indicating that many new positions were established in a concentrated way on August 27. 24-hour trading value reached 273.66M—up from the previous day’s 8.30M by 32.99x—showing a very high degree of volume participation. However, the funding rate is currently only 0.005%. While it is mildly bullish, it’s not crowded. Even during August 27, it briefly turned negative intraday, suggesting chase-the-rally sentiment hasn’t spiraled out of control.
PerpPulse recorded an L1_WATCH alert at 14:00 on August 27. At that time the price was 0.9838, and later at 20:00 it was upgraded to L2_PERSISTENT, with the price at 0.9787. In this period, the highest price touched 1.0611, for a maximum return of 7.86% after the first alert. Judging from how the data evolved, after the alert OI continued to climb from 5.70M to 6.76M, and volume also stayed elevated. The market structure is indeed moving in a strong direction.
The current position is at the 66.6% percentile within the 7-day range. The nearest overhead pressure is the rebound high at 1.0611. Above that is the extreme end of the range at 1.1698. On the downside, first support to watch is in the 0.9238–0.9350 area. If price breaks below that, 0.8618 becomes the next observation level. Going forward, watch whether volume can continue to stay high, whether OI is still increasing (adding positions), and whether price can hold above 0.98. If there’s a breakdown with heavy volume below 0.9238, the short-term weakening signal would be fairly clear.
Full anomaly data: perppulse.xyz