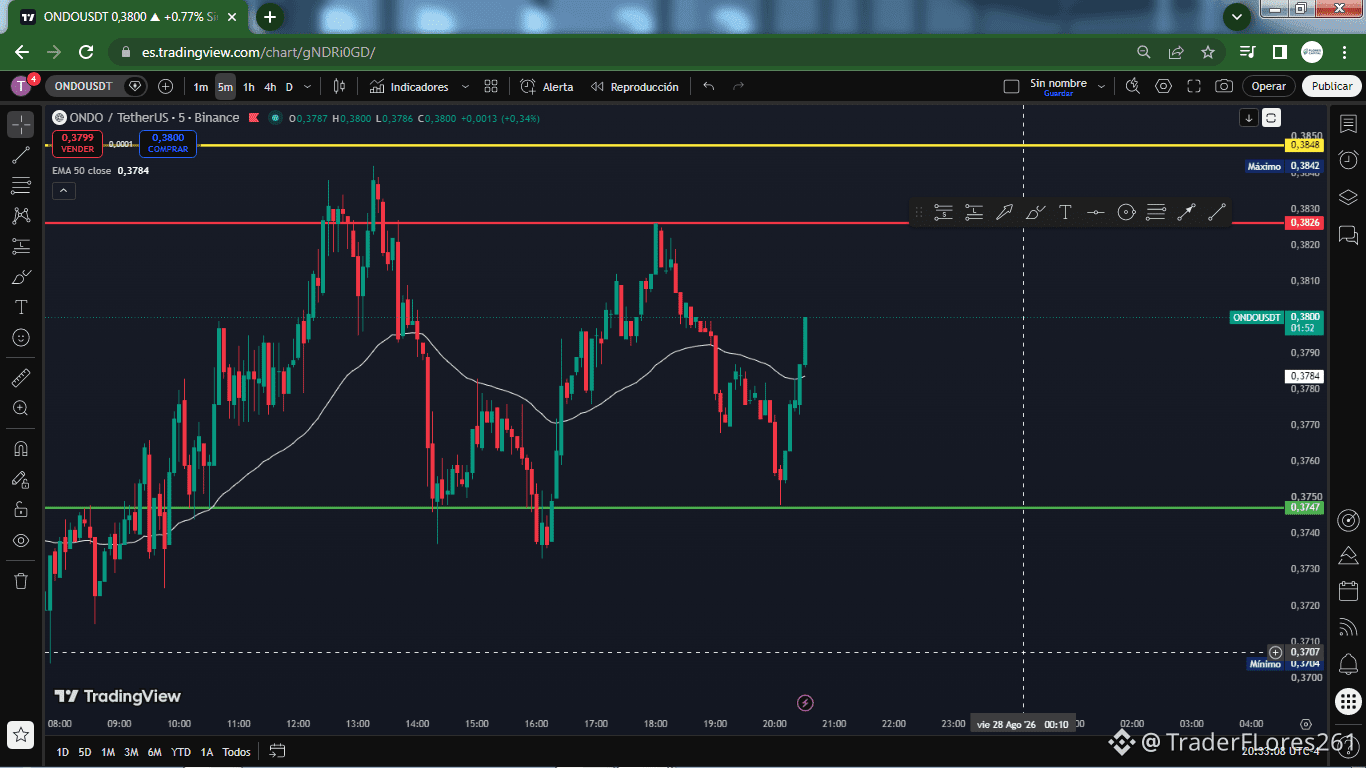
$ONDO / USDT: Recovery of structure and mid-range test
ONDO is trading at $0.3780, trying to consolidate above the 50 EMA on higher timeframes after bouncing from the lower end of the range.
Structure and key levels:
Immediate Resistance (Red Line): $0.3826 in the 5m microstructure ($0.3784 in 4h / 1h). A recent ceiling zone that marks the path toward the upper side.
Previous Day High (Upper Yellow Line): $0.3848. Key liquidity maximum on 1h and 4h for bullish continuation.
Support Zone (Green Line): $0.3747 on 5m/1h ($0.3743 on 4h). A defensive level where buyers have reacted to maintain the structure.
Previous Day Low (Lower Yellow Line): $0.3661. Key macro support where price marked the prior floor.
EMA 50 (White Line): It is at $0.3783 on 5m, $0.3737 on 1h, and $0.3679 on 4h, acting as the central dynamic pivot.
What is the price doing now?
On the 4h and 1h charts, ONDO is holding a bullish structure above the 50 EMA ($0.3737 - $0.3679), building strength after pressing the red line.
On the 5-minute timeframe, the price rejected around $0.3826 and is currently trading right at the 50 EMA ($0.3783), trying to stabilize above the green support of $0.3747 to resume the momentum.
What scenario are you monitoring?
If ONDO manages to consolidate above the 50 EMA and break the resistance at $0.3826, the next clear target is the $0.3848 ceiling.
Manage your risk, confirm your entry, and trade with discipline!
Click on FOLLOW to not miss the best signals and real-time analysis! 📲💬
ONDO is trading at $0.3780, trying to consolidate above the 50 EMA on higher timeframes after bouncing from the lower end of the range.
Structure and key levels:
Immediate Resistance (Red Line): $0.3826 in the 5m microstructure ($0.3784 in 4h / 1h). A recent ceiling zone that marks the path toward the upper side.
Previous Day High (Upper Yellow Line): $0.3848. Key liquidity maximum on 1h and 4h for bullish continuation.
Support Zone (Green Line): $0.3747 on 5m/1h ($0.3743 on 4h). A defensive level where buyers have reacted to maintain the structure.
Previous Day Low (Lower Yellow Line): $0.3661. Key macro support where price marked the prior floor.
EMA 50 (White Line): It is at $0.3783 on 5m, $0.3737 on 1h, and $0.3679 on 4h, acting as the central dynamic pivot.
What is the price doing now?
On the 4h and 1h charts, ONDO is holding a bullish structure above the 50 EMA ($0.3737 - $0.3679), building strength after pressing the red line.
On the 5-minute timeframe, the price rejected around $0.3826 and is currently trading right at the 50 EMA ($0.3783), trying to stabilize above the green support of $0.3747 to resume the momentum.
What scenario are you monitoring?
If ONDO manages to consolidate above the 50 EMA and break the resistance at $0.3826, the next clear target is the $0.3848 ceiling.
Manage your risk, confirm your entry, and trade with discipline!
Click on FOLLOW to not miss the best signals and real-time analysis! 📲💬