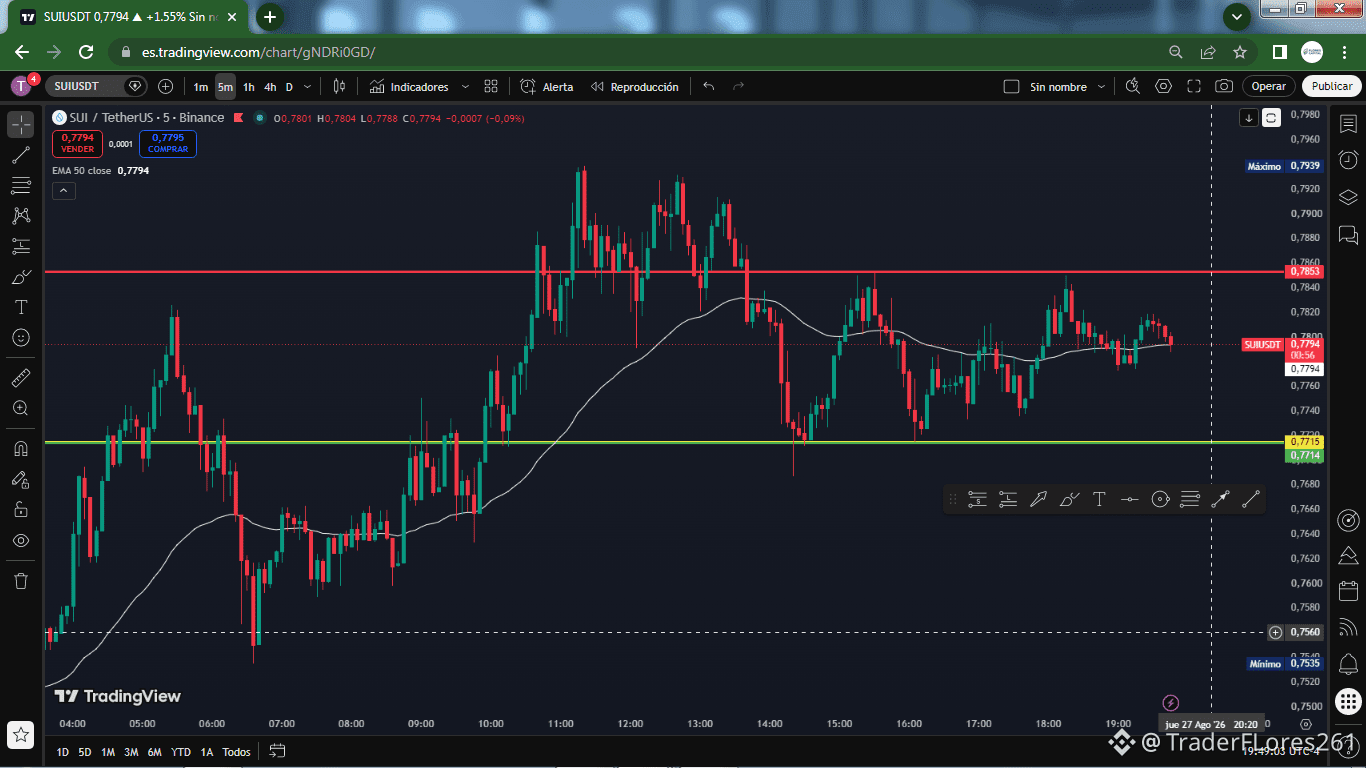
$SUI / USDT: Consolidation at a Key Level and Support Test
SUI is trading around $0.7790 ($0.7800 in 1h/4h), trying to hold above the 50 EMA on the 5-minute chart after pulling back from the high-structure resistance.
Structure and key levels:
Immediate Resistance (Red Line): $0.7853 on the 5m micro chart ($0.7940 in 1h / 4h). Ceiling of the recent consolidation where sell orders have rejected the price.
Previous Day High (Upper Yellow Line): $0.7715 on 5m/1h. Key liquidity level that has been broken and now acts as the main support for the current range.
Support to Hold (Green Line): $0.7714 on 5m ($0.7800 at an intermediate structural level). Defensive zone previously used to maintain the bullish structure.
Previous Day Floor (Lower Yellow Line): $0.7249. The minimum of the previous session on higher timeframes of 1h/4h.
50 EMA (White Line): It runs through $0.7793 on 5m, $0.7705 on 1h, and $0.7687 on 4h, acting as a pivot point for buyer interaction.
What is the price doing right now?
On the 5-minute timeframe, SUI is trading almost exactly around the 50 EMA at $0.7793, trying to confirm itself after the rejection in the red resistance zone of $0.7853.
The price remains above the yellow line at $0.7715, accumulating volume to attempt a new buying push.
Are you ready with your trading plan?
If SUI manages to consolidate above the 50 EMA and break the red line at $0.7853, we could see a direct move toward $0.7940.
Manage your risk, confirm your entry, and trade with discipline!
Click FOLLOW so you don’t miss the best signals and real-time analysis! 📲💬
SUI is trading around $0.7790 ($0.7800 in 1h/4h), trying to hold above the 50 EMA on the 5-minute chart after pulling back from the high-structure resistance.
Structure and key levels:
Immediate Resistance (Red Line): $0.7853 on the 5m micro chart ($0.7940 in 1h / 4h). Ceiling of the recent consolidation where sell orders have rejected the price.
Previous Day High (Upper Yellow Line): $0.7715 on 5m/1h. Key liquidity level that has been broken and now acts as the main support for the current range.
Support to Hold (Green Line): $0.7714 on 5m ($0.7800 at an intermediate structural level). Defensive zone previously used to maintain the bullish structure.
Previous Day Floor (Lower Yellow Line): $0.7249. The minimum of the previous session on higher timeframes of 1h/4h.
50 EMA (White Line): It runs through $0.7793 on 5m, $0.7705 on 1h, and $0.7687 on 4h, acting as a pivot point for buyer interaction.
What is the price doing right now?
On the 5-minute timeframe, SUI is trading almost exactly around the 50 EMA at $0.7793, trying to confirm itself after the rejection in the red resistance zone of $0.7853.
The price remains above the yellow line at $0.7715, accumulating volume to attempt a new buying push.
Are you ready with your trading plan?
If SUI manages to consolidate above the 50 EMA and break the red line at $0.7853, we could see a direct move toward $0.7940.
Manage your risk, confirm your entry, and trade with discipline!
Click FOLLOW so you don’t miss the best signals and real-time analysis! 📲💬