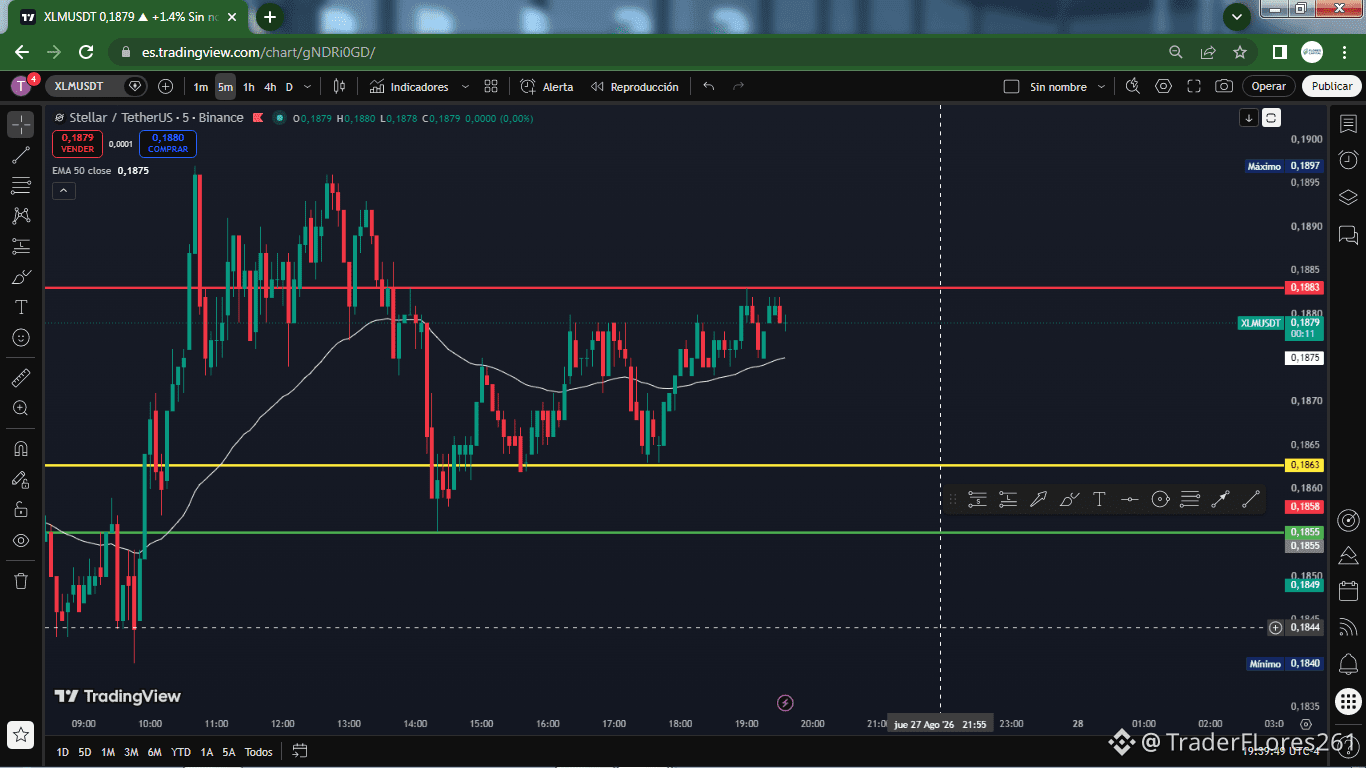
$XLM / USDT: Retracement of the 50-day EMA and test of the key resistance
Stellar is trading at $0.1881, consolidating a bullish move after holding the dynamic support and staying above the previous day’s ceiling.
Structure and key levels:
Immediate Resistance (Red Line): $0.1883 in the 5m micro structure ($0.1884 in 1h / $0.1899 in 4h). Level where the price finds sell orders in search of a breakout.
Previous Day Ceiling (Upper Yellow Line): $0.1863. Key liquidity level of the day that has been surpassed, acting as the first control support.
Support to Hold (Green Line): $0.1855 in 5m ($0.1875 in 1h).
Prior buyer reaction zone within the intraday structure.
Previous Day Floor (Lower Yellow Line): $0.1776 ($0.1858 in the intermediate 4h structure). Main defensive zone.
50 EMA (White Line): Ranges around $0.1875 in 5m, $0.1862 in 1h, and $0.1848 in 4h, confirming the bullish alignment of price across multiple timeframes.
What is the price doing right now?
On the 5-minute chart, XLM managed to recover and hold the 50 EMA at $0.1875, marking higher lows above the yellow line at $0.1863. It is currently directly testing the red line at $0.1883 in an attempt to accelerate toward the range highs.
Do you have your position ready?
If XLM manages to consolidate and close above $0.1883, we could see an extended move toward the $0.1900+ area.
Adjust your risk management, watch the volume, and take advantage of the move!
Click FOLLOW so you don’t miss the best signals and real-time analysis! 📲💬
Stellar is trading at $0.1881, consolidating a bullish move after holding the dynamic support and staying above the previous day’s ceiling.
Structure and key levels:
Immediate Resistance (Red Line): $0.1883 in the 5m micro structure ($0.1884 in 1h / $0.1899 in 4h). Level where the price finds sell orders in search of a breakout.
Previous Day Ceiling (Upper Yellow Line): $0.1863. Key liquidity level of the day that has been surpassed, acting as the first control support.
Support to Hold (Green Line): $0.1855 in 5m ($0.1875 in 1h).
Prior buyer reaction zone within the intraday structure.
Previous Day Floor (Lower Yellow Line): $0.1776 ($0.1858 in the intermediate 4h structure). Main defensive zone.
50 EMA (White Line): Ranges around $0.1875 in 5m, $0.1862 in 1h, and $0.1848 in 4h, confirming the bullish alignment of price across multiple timeframes.
What is the price doing right now?
On the 5-minute chart, XLM managed to recover and hold the 50 EMA at $0.1875, marking higher lows above the yellow line at $0.1863. It is currently directly testing the red line at $0.1883 in an attempt to accelerate toward the range highs.
Do you have your position ready?
If XLM manages to consolidate and close above $0.1883, we could see an extended move toward the $0.1900+ area.
Adjust your risk management, watch the volume, and take advantage of the move!
Click FOLLOW so you don’t miss the best signals and real-time analysis! 📲💬