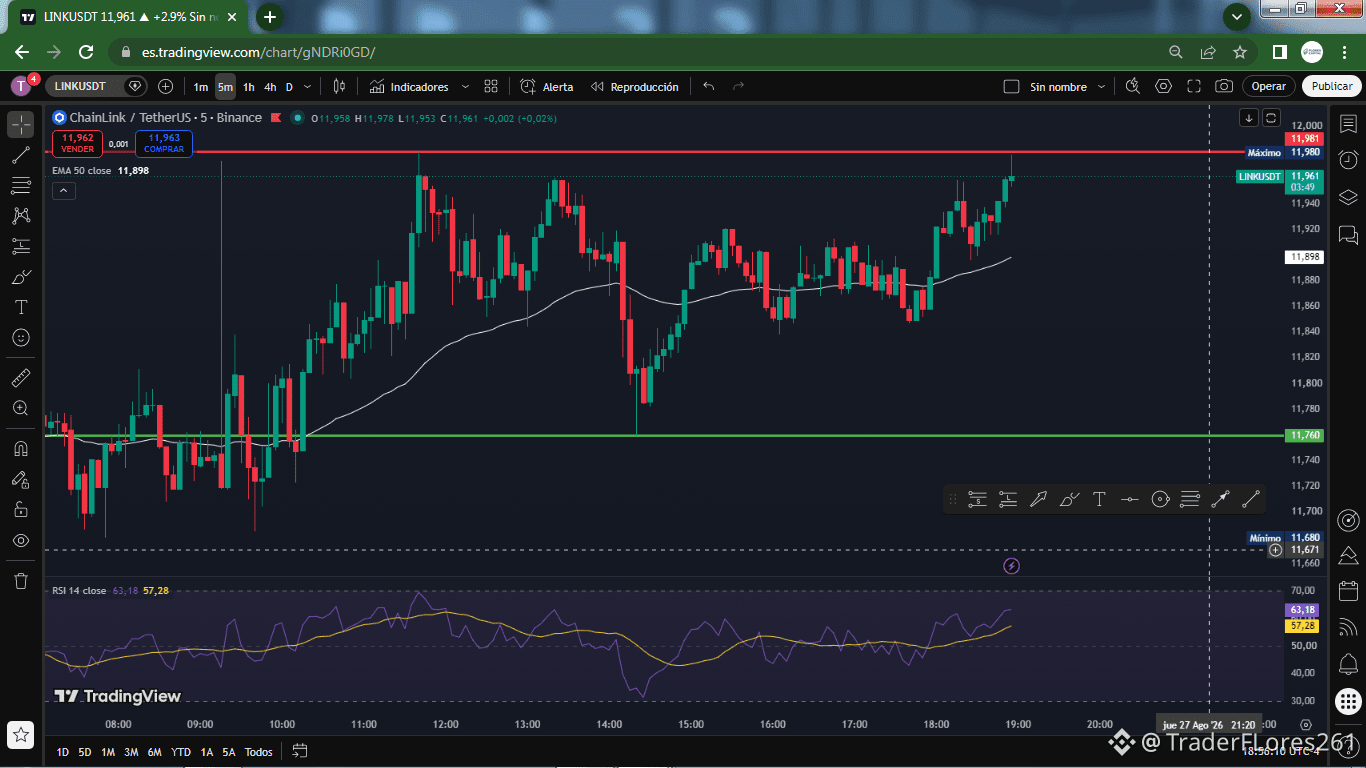
$LINK / USDT: Bullish pressure looking to break the resistance of $11.98
LINK is trading at $11.947, maintaining a clear bullish structure above the dynamic support and targeting the upper end of the range on the 5-minute chart.
Structure and key levels:
Immediate Resistance (Red Line): $11.980 (micro level on 5m/1h around $11.973 / $11.985). Current maximum of the structure where selling has stopped recent advances.
Previous Day High (Upper Yellow Line): $11.637 ($11.644 on 1h). Key resistance broken, validating the current bullish momentum.
Support for Consolidation (Green Line): $11.760. Current minimum of the structure and the first consolidation level.
Previous Day Low (Lower Yellow Line):
$11.058. Minimum of the previous session and the main defensive zone on higher timeframes.
EMA 50 (White Line): Passes through $11.895 on the 5-minute chart (and $11.644 on 1h), acting as a dynamic support ramp for price.
What is the price doing right now?
On the 5-minute timeframe, LINK is constantly marking higher lows, staying above the EMA 50.
After holding above the green zone at $11.760, the price is accumulating volume in an attempt to definitively break the red line at $11.980.
Do you have your trade set up?
If LINK manages to break strongly above $11.980, we could see a move toward the $12.00+ zone.
Prepare your entry, manage your risk, and trade in favor of the trend!
Click FOLLOW to not miss the best signals and real-time analysis! 📲💬
LINK is trading at $11.947, maintaining a clear bullish structure above the dynamic support and targeting the upper end of the range on the 5-minute chart.
Structure and key levels:
Immediate Resistance (Red Line): $11.980 (micro level on 5m/1h around $11.973 / $11.985). Current maximum of the structure where selling has stopped recent advances.
Previous Day High (Upper Yellow Line): $11.637 ($11.644 on 1h). Key resistance broken, validating the current bullish momentum.
Support for Consolidation (Green Line): $11.760. Current minimum of the structure and the first consolidation level.
Previous Day Low (Lower Yellow Line):
$11.058. Minimum of the previous session and the main defensive zone on higher timeframes.
EMA 50 (White Line): Passes through $11.895 on the 5-minute chart (and $11.644 on 1h), acting as a dynamic support ramp for price.
What is the price doing right now?
On the 5-minute timeframe, LINK is constantly marking higher lows, staying above the EMA 50.
After holding above the green zone at $11.760, the price is accumulating volume in an attempt to definitively break the red line at $11.980.
Do you have your trade set up?
If LINK manages to break strongly above $11.980, we could see a move toward the $12.00+ zone.
Prepare your entry, manage your risk, and trade in favor of the trend!
Click FOLLOW to not miss the best signals and real-time analysis! 📲💬