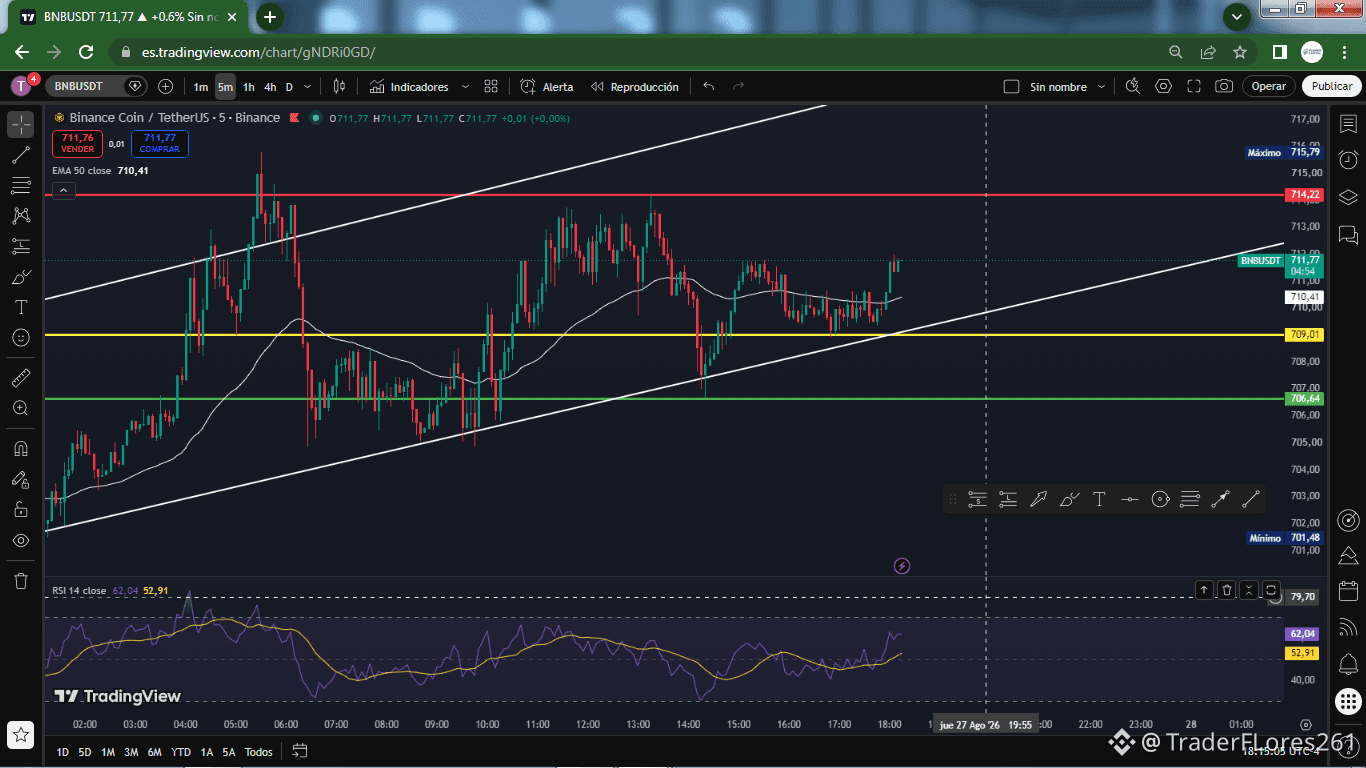
$BNB / USDT: Upward channel and key resistance test
BNB is trading at $711.67, moving flawlessly within an ascending channel on the 5-minute chart and maintaining a clear bullish bias after respecting dynamic support.
Structure and key levels:
Immediate Resistance (Red Line): $714.22. Current structure high. This is the key barrier to break in order to target the upper part of the channel.
Previous Day High (Upper Yellow Line): $709.01. Level that has been surpassed and now serves as the first operational support floor.
Support for Retest (Green Line): $706.64. Current structure low and the prior retest area.
Previous Day Low (Lower Yellow Line): $691.03. Structural base and the previous day’s minimum.
EMA 50 (White Line): Around $710.35 on 5m, acting as dynamic support that is sustaining the current rise.
What is the price doing now?
On the 5-minute timeframe, BNB perfectly held the base of the ascending channel and above the yellow line ($709.01), reacting to the upside near the EMA 50. Price is looking for momentum to attack the red line at $714.22 and continue with the channel’s trend.
Ready for the move? If BNB breaks $714.22 with strength, we could see bullish acceleration.
Prepare your trade, manage your risk, and trade with the market!
Click FOLLOW to not miss the next analysis and the best real-time opportunities! 📲💬
BNB is trading at $711.67, moving flawlessly within an ascending channel on the 5-minute chart and maintaining a clear bullish bias after respecting dynamic support.
Structure and key levels:
Immediate Resistance (Red Line): $714.22. Current structure high. This is the key barrier to break in order to target the upper part of the channel.
Previous Day High (Upper Yellow Line): $709.01. Level that has been surpassed and now serves as the first operational support floor.
Support for Retest (Green Line): $706.64. Current structure low and the prior retest area.
Previous Day Low (Lower Yellow Line): $691.03. Structural base and the previous day’s minimum.
EMA 50 (White Line): Around $710.35 on 5m, acting as dynamic support that is sustaining the current rise.
What is the price doing now?
On the 5-minute timeframe, BNB perfectly held the base of the ascending channel and above the yellow line ($709.01), reacting to the upside near the EMA 50. Price is looking for momentum to attack the red line at $714.22 and continue with the channel’s trend.
Ready for the move? If BNB breaks $714.22 with strength, we could see bullish acceleration.
Prepare your trade, manage your risk, and trade with the market!
Click FOLLOW to not miss the next analysis and the best real-time opportunities! 📲💬