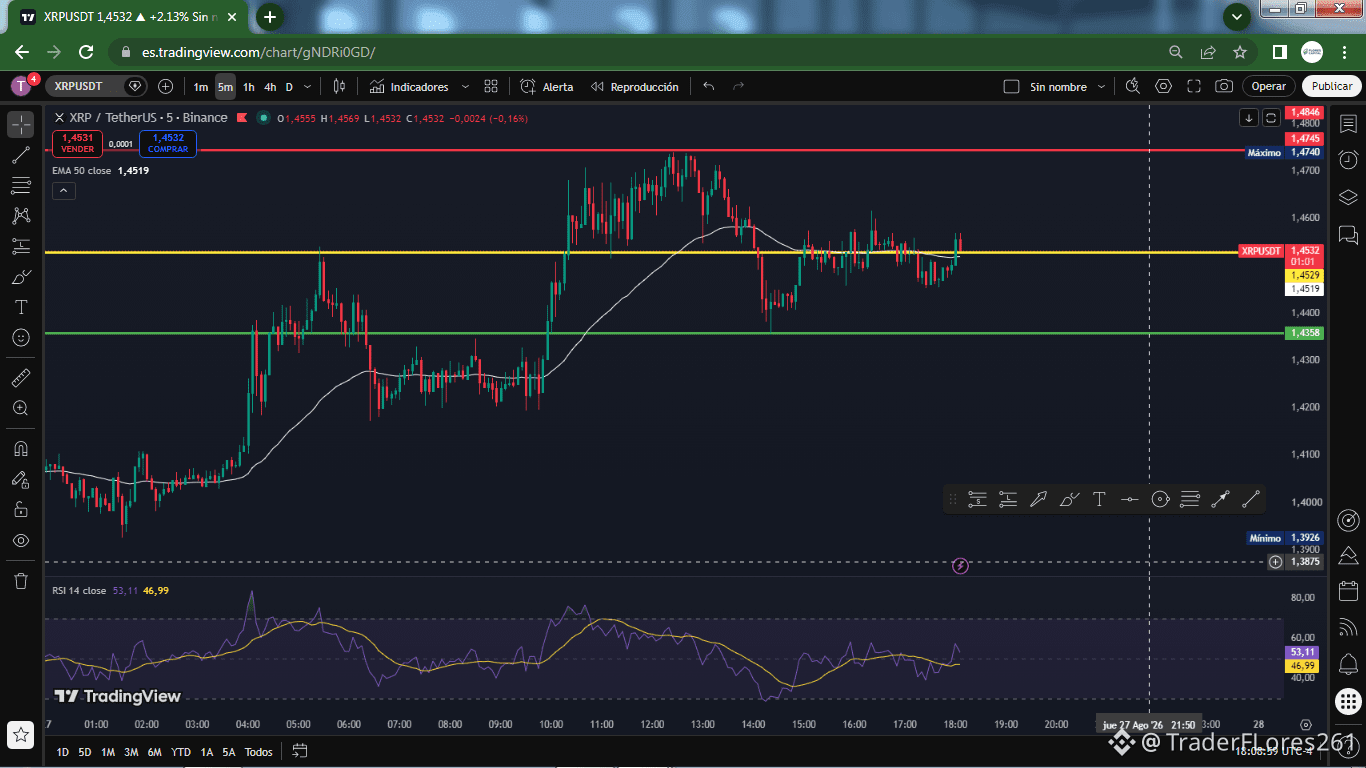
$XRP / USDT: Attempted recovery and resistance around $1.47
XRP is trading at $1.4543, looking to consolidate its position above $1.4529 after bouncing off the lower end of the intraday range.
Structure and key levels:
Previous Day High (Upper Yellow Line): $1.4529. The previous session’s maximum where price is still struggling to firmly establish itself.
Immediate Resistance (Red Line): $1.4745. The current maximum of the structure where selling capped the last push.
Support Floor (Green Line): $1.4358. The current minimum of the structure where buyers stepped in to trigger the bounce.
Previous Day Low (Lower Yellow Line): $1.3576. The previous session’s minimum and a key support level on higher timeframes.
EMA 50 (White Line): Dynamically crossing at $1.4518 (5m chart), acting as an immediate support ramp.
What is the price doing right now?
On the 5-minute chart, XRP reacted from the bottom of the range at $1.4358 (green line) and launched a strong move toward $1.4745 (red line). Currently, price is resting just above the yellow line and the 50 EMA, building strength to define the next move.
Do you have your trade ready? If you think XRP will break above $1.4745 to seek new highs, get your trade ready right now and stay alert to the market!
🔥 Don’t forget to FOLLOW MY ACCOUNT so you don’t miss the next analysis and the best real-time signals! 📲💬
XRP is trading at $1.4543, looking to consolidate its position above $1.4529 after bouncing off the lower end of the intraday range.
Structure and key levels:
Previous Day High (Upper Yellow Line): $1.4529. The previous session’s maximum where price is still struggling to firmly establish itself.
Immediate Resistance (Red Line): $1.4745. The current maximum of the structure where selling capped the last push.
Support Floor (Green Line): $1.4358. The current minimum of the structure where buyers stepped in to trigger the bounce.
Previous Day Low (Lower Yellow Line): $1.3576. The previous session’s minimum and a key support level on higher timeframes.
EMA 50 (White Line): Dynamically crossing at $1.4518 (5m chart), acting as an immediate support ramp.
What is the price doing right now?
On the 5-minute chart, XRP reacted from the bottom of the range at $1.4358 (green line) and launched a strong move toward $1.4745 (red line). Currently, price is resting just above the yellow line and the 50 EMA, building strength to define the next move.
Do you have your trade ready? If you think XRP will break above $1.4745 to seek new highs, get your trade ready right now and stay alert to the market!
🔥 Don’t forget to FOLLOW MY ACCOUNT so you don’t miss the next analysis and the best real-time signals! 📲💬