$ETH / USDT: Consolidation under resistance and an attempt to recover 🚀
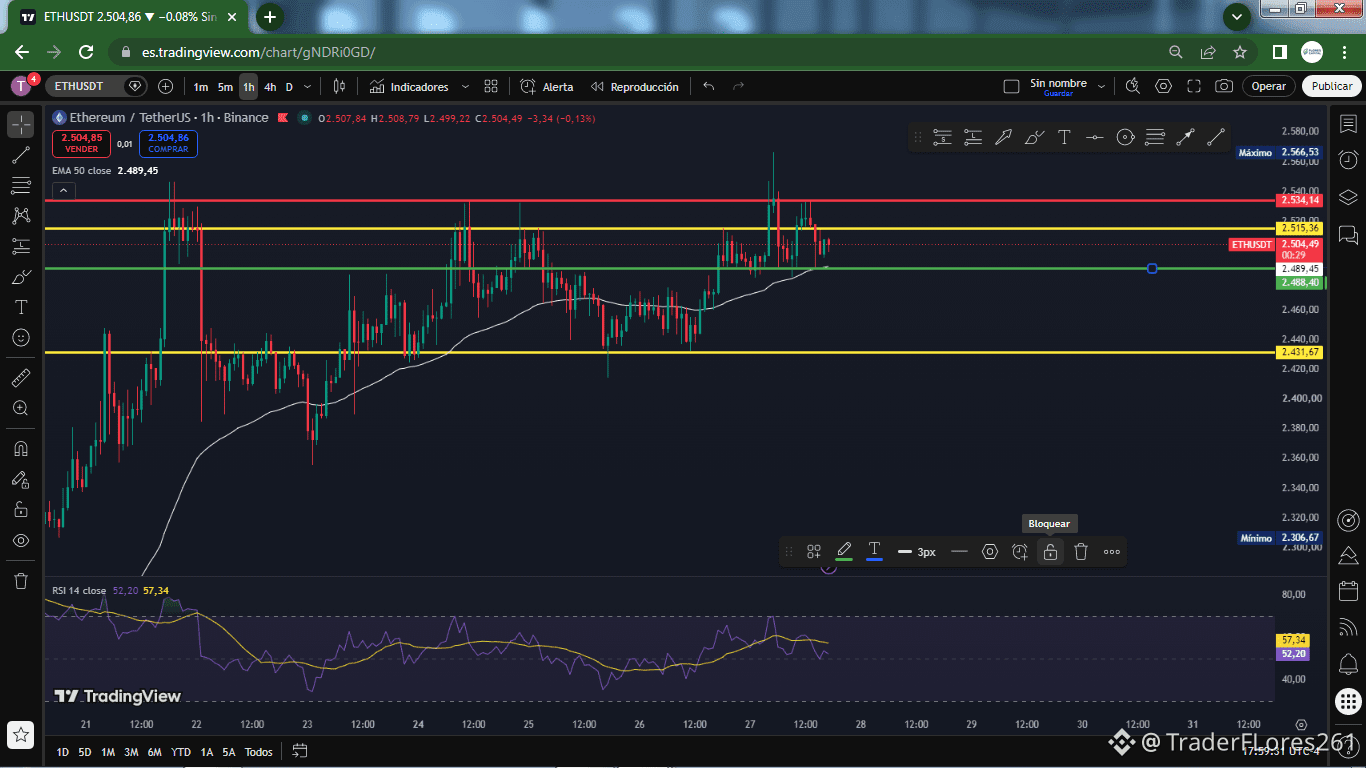
Ethereum is trading around $2,503.43 on the 5-minute chart, seeking to regain bullish momentum after a pullback from the previous day’s high zone at $2,515.36.
Structure and key levels:
Previous Day’s High (Upper Yellow Line): $2,515.36. This is the highest price marked during the previous session, acting as the first key barrier to break.
Immediate Resistance (Red Line): $2,534.14. The upper sell zone where the price strongly rejected after its last major upward push.
Support Floor (Green Line): $2,488.40 - $2,489.39. A solid base where buyers stepped in on the intraday chart to stop the decline.
Previous Day’s Low (Lower Yellow Line): $2,431.67. The main support level on higher timeframes (1H / 4H).
White Line (50-period Moving Average): It is dynamically located near $2,505.77, acting as short-term resistance that price is trying to break upward.
What is the price doing now?
On the 5-minute timeframe, after the rejection at the top above the red line, ETH saw a correction that found support at $2,488.40. Currently, a bounce is being observed, trying to consolidate above $2,500 in order to retest the white line and once again target the yellow line.
Do you think the price will have the volume needed to break the yellow line at $2,515 or will it go back to seek support in the green zone at $2,488?
Ethereum is trading around $2,503.43 on the 5-minute chart, seeking to regain bullish momentum after a pullback from the previous day’s high zone at $2,515.36.
Structure and key levels:
Previous Day’s High (Upper Yellow Line): $2,515.36. This is the highest price marked during the previous session, acting as the first key barrier to break.
Immediate Resistance (Red Line): $2,534.14. The upper sell zone where the price strongly rejected after its last major upward push.
Support Floor (Green Line): $2,488.40 - $2,489.39. A solid base where buyers stepped in on the intraday chart to stop the decline.
Previous Day’s Low (Lower Yellow Line): $2,431.67. The main support level on higher timeframes (1H / 4H).
White Line (50-period Moving Average): It is dynamically located near $2,505.77, acting as short-term resistance that price is trying to break upward.
What is the price doing now?
On the 5-minute timeframe, after the rejection at the top above the red line, ETH saw a correction that found support at $2,488.40. Currently, a bounce is being observed, trying to consolidate above $2,500 in order to retest the white line and once again target the yellow line.
Do you think the price will have the volume needed to break the yellow line at $2,515 or will it go back to seek support in the green zone at $2,488?