Technical Analysis BNB (1H)
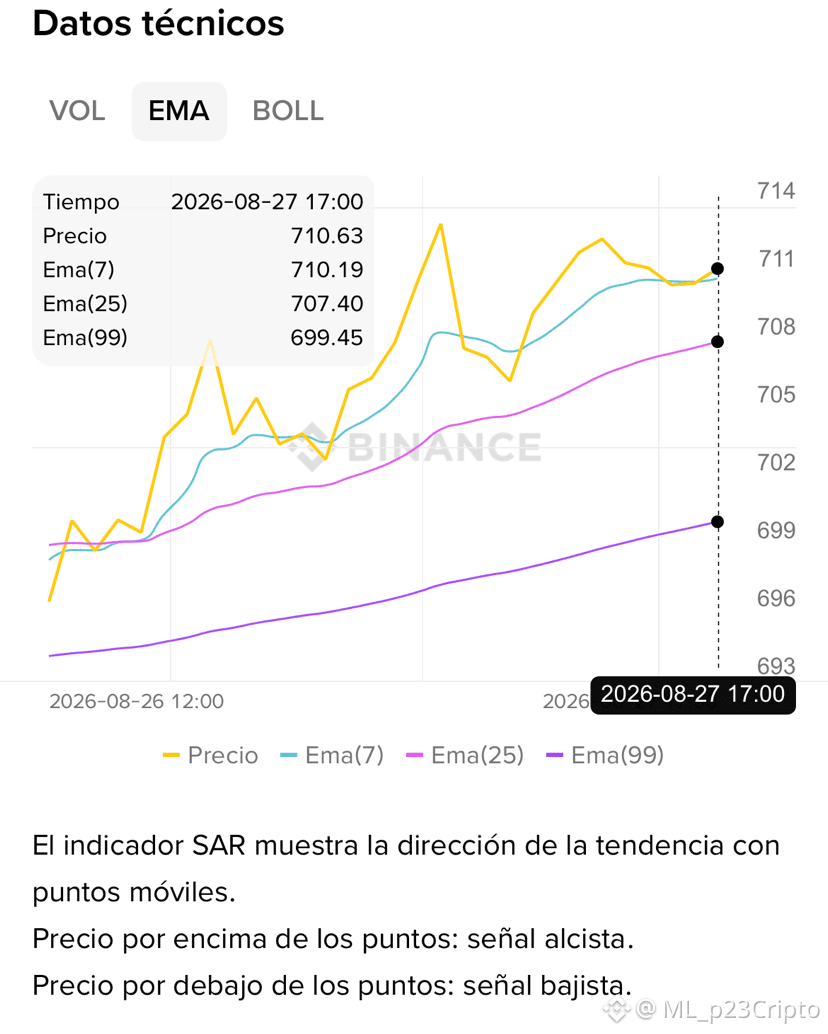
• Current Trend: BNB is trading at 710.63, showing a slight consolidation after a recent bullish impulse. The 7-period EMA (710.19) remains above the 25-period EMA (707.39), indicating a short-term uptrend.
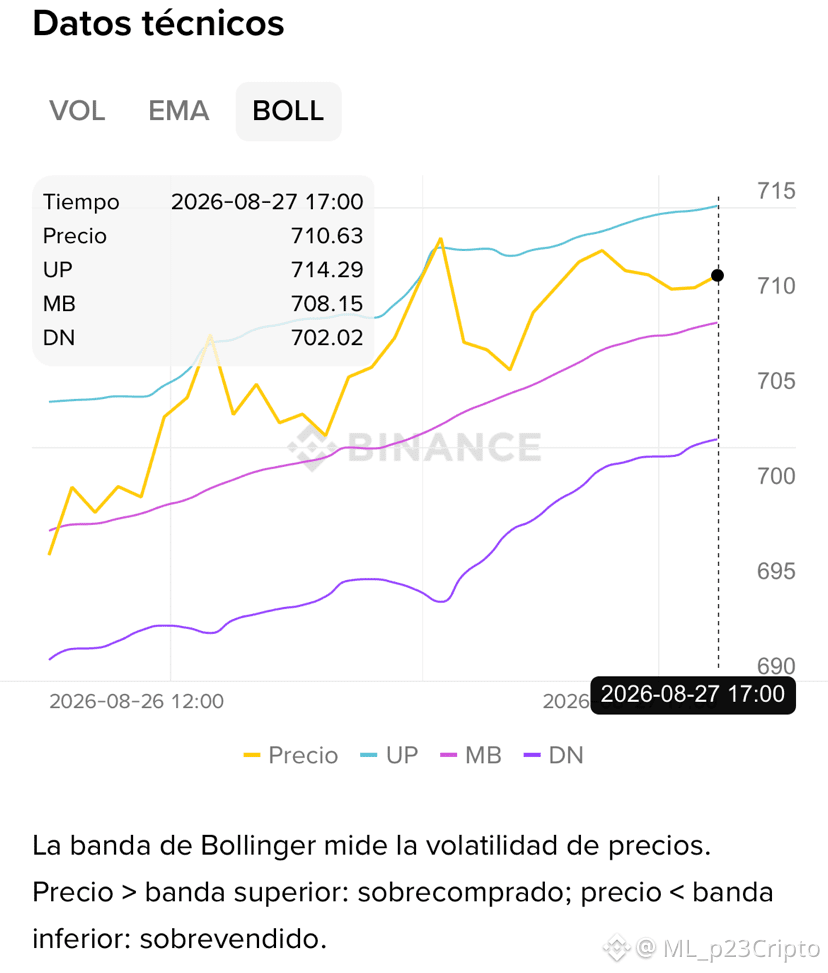
• Volatility: The Bollinger Bands show compression, with the upper band at 714.29 and the lower band at 702.02, suggesting a possible decrease in volatility or an accumulation period before a significant move.
Key Levels and Signals
• Immediate Support: The Bollinger middle band at 708.15 and the 25-period EMA at 707.39 act as strong supports. Buying at these levels could offer a good risk/reward ratio.
• Key Resistance: The upper Bollinger band at 714.29 represents immediate resistance. Taking partial or full profits near this level is prudent if no strong bullish momentum is observed.
• Sell Signal: If the price breaks below the 25-period EMA, a sell target could be 702.02
(lower Bollinger band).
#BNB #USD
• Current Trend: BNB is trading at 710.63, showing a slight consolidation after a recent bullish impulse. The 7-period EMA (710.19) remains above the 25-period EMA (707.39), indicating a short-term uptrend.
• Volatility: The Bollinger Bands show compression, with the upper band at 714.29 and the lower band at 702.02, suggesting a possible decrease in volatility or an accumulation period before a significant move.
Key Levels and Signals
• Immediate Support: The Bollinger middle band at 708.15 and the 25-period EMA at 707.39 act as strong supports. Buying at these levels could offer a good risk/reward ratio.
• Key Resistance: The upper Bollinger band at 714.29 represents immediate resistance. Taking partial or full profits near this level is prudent if no strong bullish momentum is observed.
• Sell Signal: If the price breaks below the 25-period EMA, a sell target could be 702.02
(lower Bollinger band).
#BNB #USD