🚨 Technical and Strategic Update for Coin $ALLO
(4-hour frame):
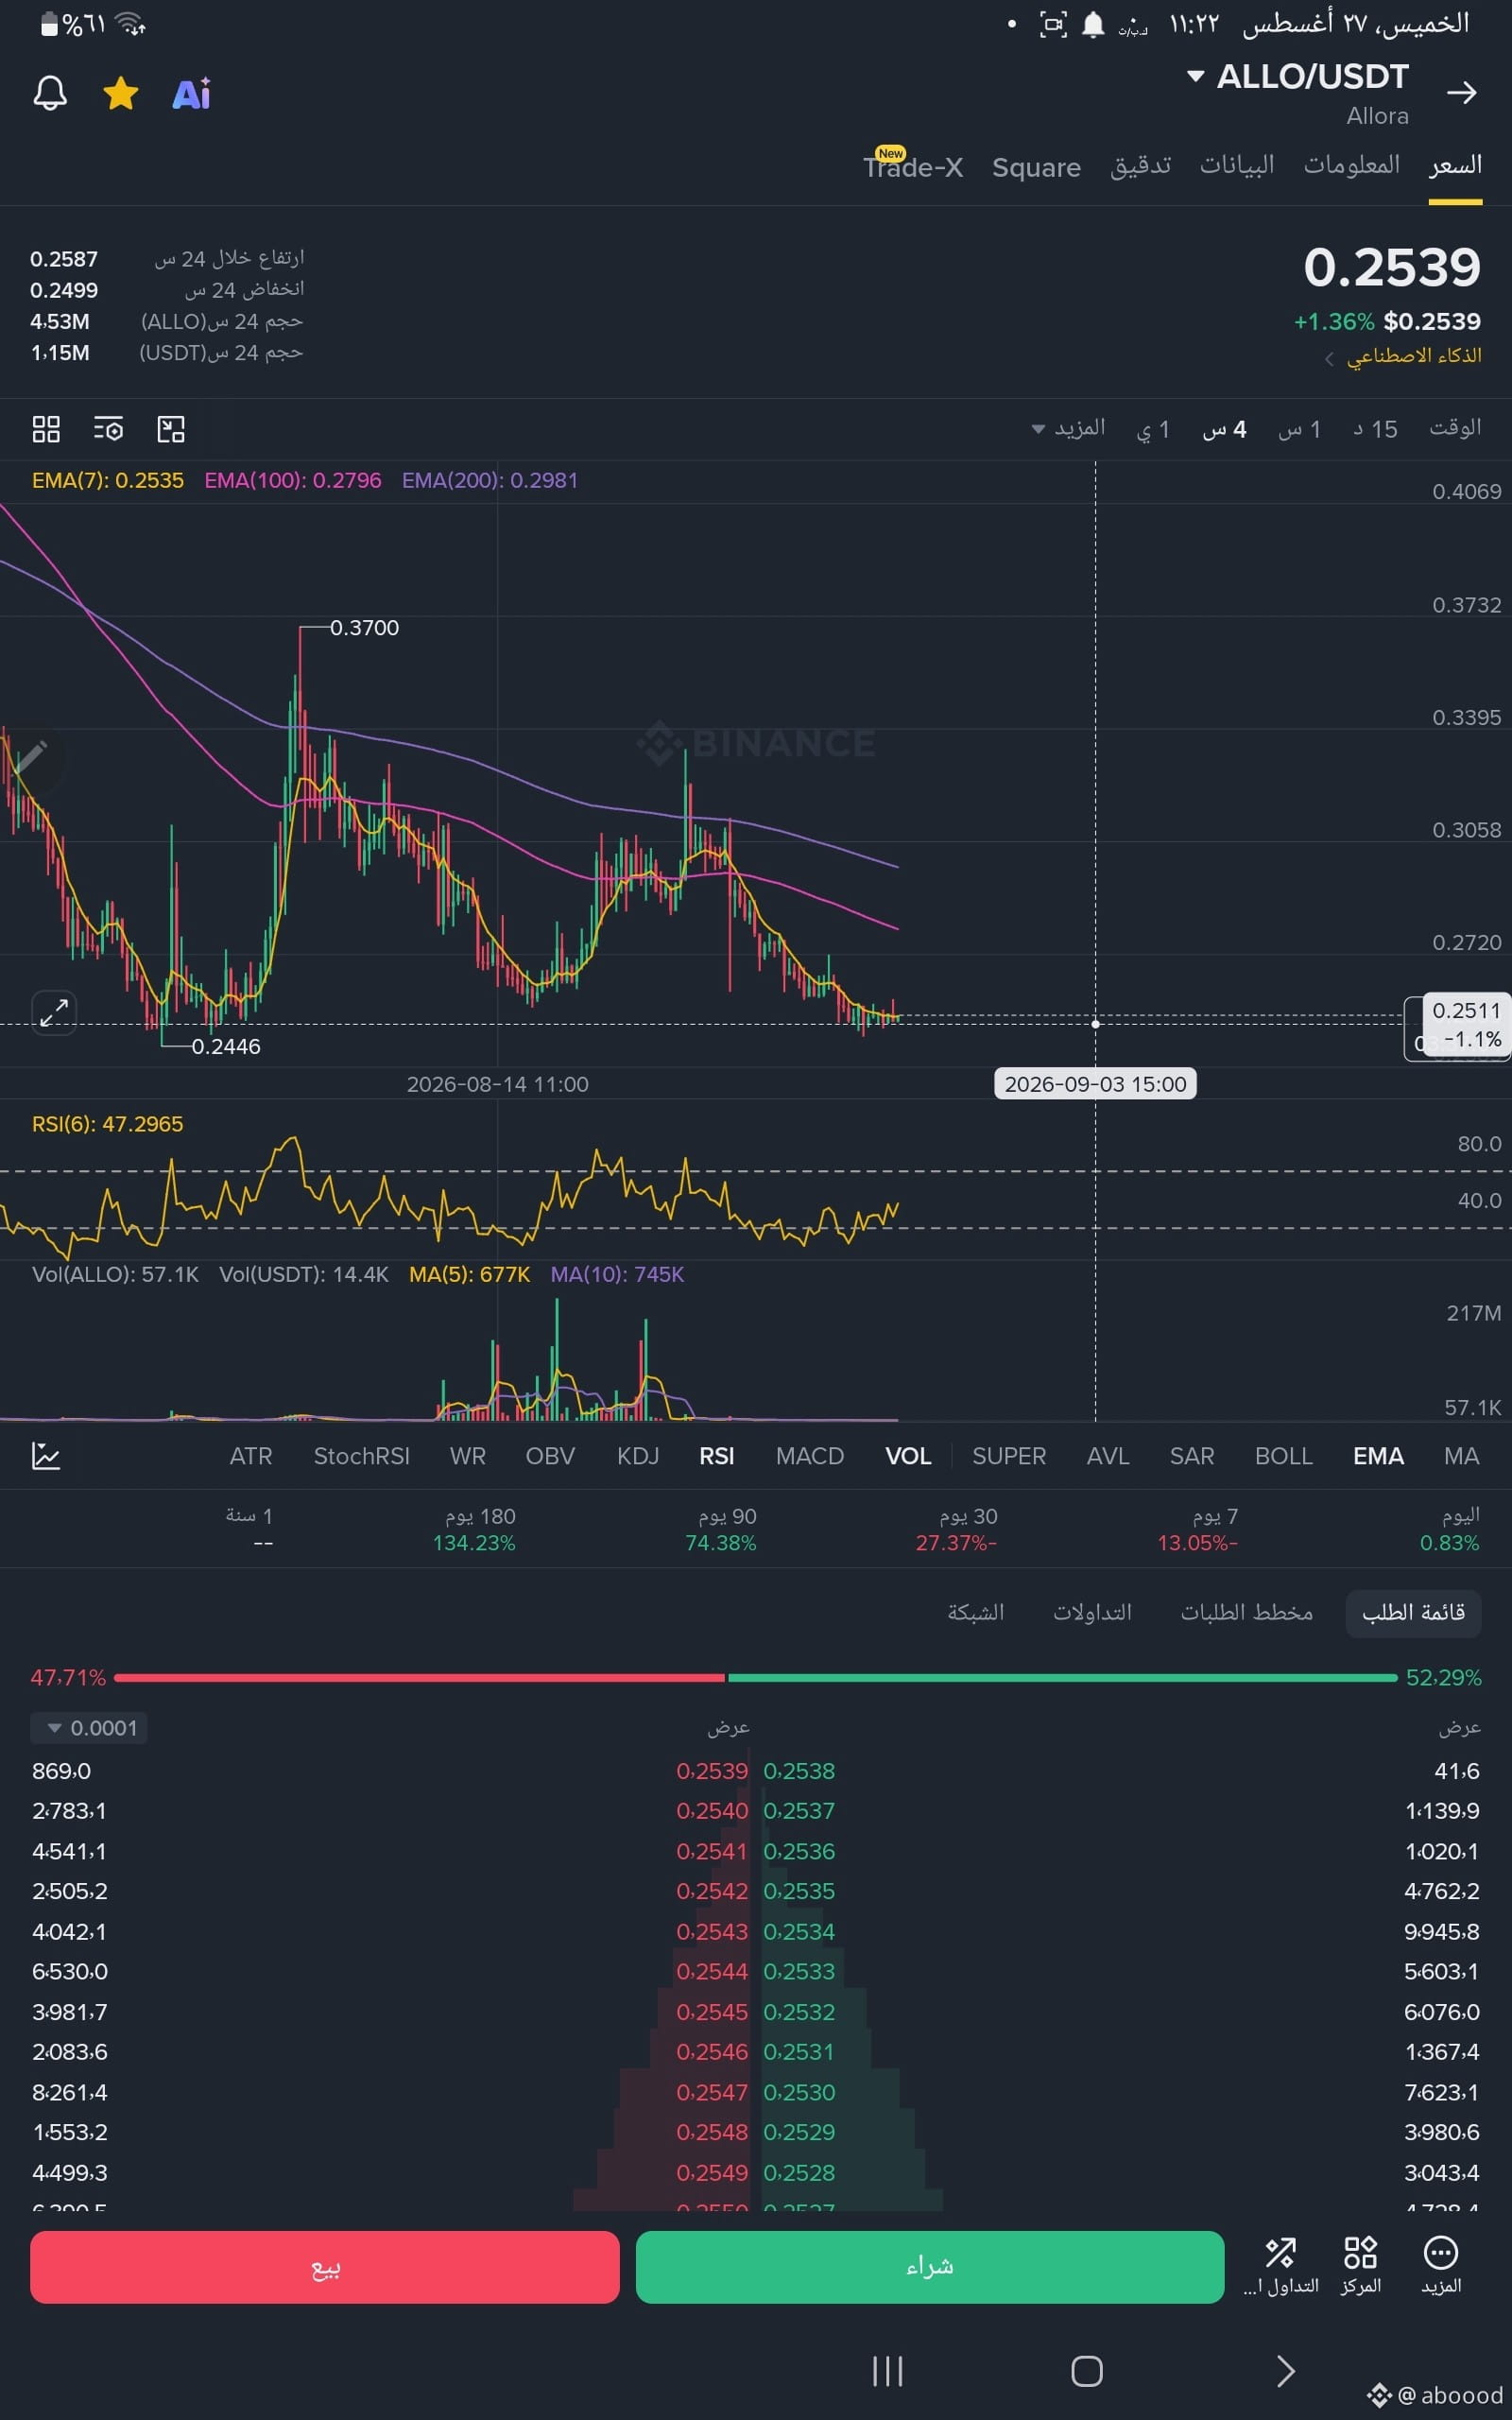
The price has managed to hold at an important technical support zone around the 0.2446 levels—the most recent low that confirmed the presence of buying forces (support liquidity). This protects the price range and prevents further bleeding.
🔥 Market Structure:
The coin is moving within a sub-bearish structure (Bearish Structure) after forming a top at 0.3700, but the current consolidation indicates the price is entering a phase of sideways accumulation (Accumulation), waiting for enough liquidity to flip the structure to bullish (Bullish MS).
📈 Current Bounce and Momentum:
Current price is trading at 0.2539.
The price succeeded in a momentary breakout and holding above the yellow EMA(7) line, stable at 0.2535.
RSI(6) indicator: Moving in a stable and upward zone around 47.29, giving the price excellent room to bounce and continue rising without excessive inflation.
🎯 The Next Specified Targets on the Chart (Take Profit):
🎯 First target (near resistance): 0.02796 (EMA 100 moving average line).
🎯 Second target: 0.02981 (strategic EMA 200 moving average).
🎯 Third target (mid peak): 0.03395.
🎯 Fourth target (major peak): 0.03700.
🛡️ Risk Management (Stop Loss):
Strict stop loss (SL): Close a full 4-hour candle below the last low level of 0.2446.
(4-hour frame):
The price has managed to hold at an important technical support zone around the 0.2446 levels—the most recent low that confirmed the presence of buying forces (support liquidity). This protects the price range and prevents further bleeding.
🔥 Market Structure:
The coin is moving within a sub-bearish structure (Bearish Structure) after forming a top at 0.3700, but the current consolidation indicates the price is entering a phase of sideways accumulation (Accumulation), waiting for enough liquidity to flip the structure to bullish (Bullish MS).
📈 Current Bounce and Momentum:
Current price is trading at 0.2539.
The price succeeded in a momentary breakout and holding above the yellow EMA(7) line, stable at 0.2535.
RSI(6) indicator: Moving in a stable and upward zone around 47.29, giving the price excellent room to bounce and continue rising without excessive inflation.
🎯 The Next Specified Targets on the Chart (Take Profit):
🎯 First target (near resistance): 0.02796 (EMA 100 moving average line).
🎯 Second target: 0.02981 (strategic EMA 200 moving average).
🎯 Third target (mid peak): 0.03395.
🎯 Fourth target (major peak): 0.03700.
🛡️ Risk Management (Stop Loss):
Strict stop loss (SL): Close a full 4-hour candle below the last low level of 0.2446.