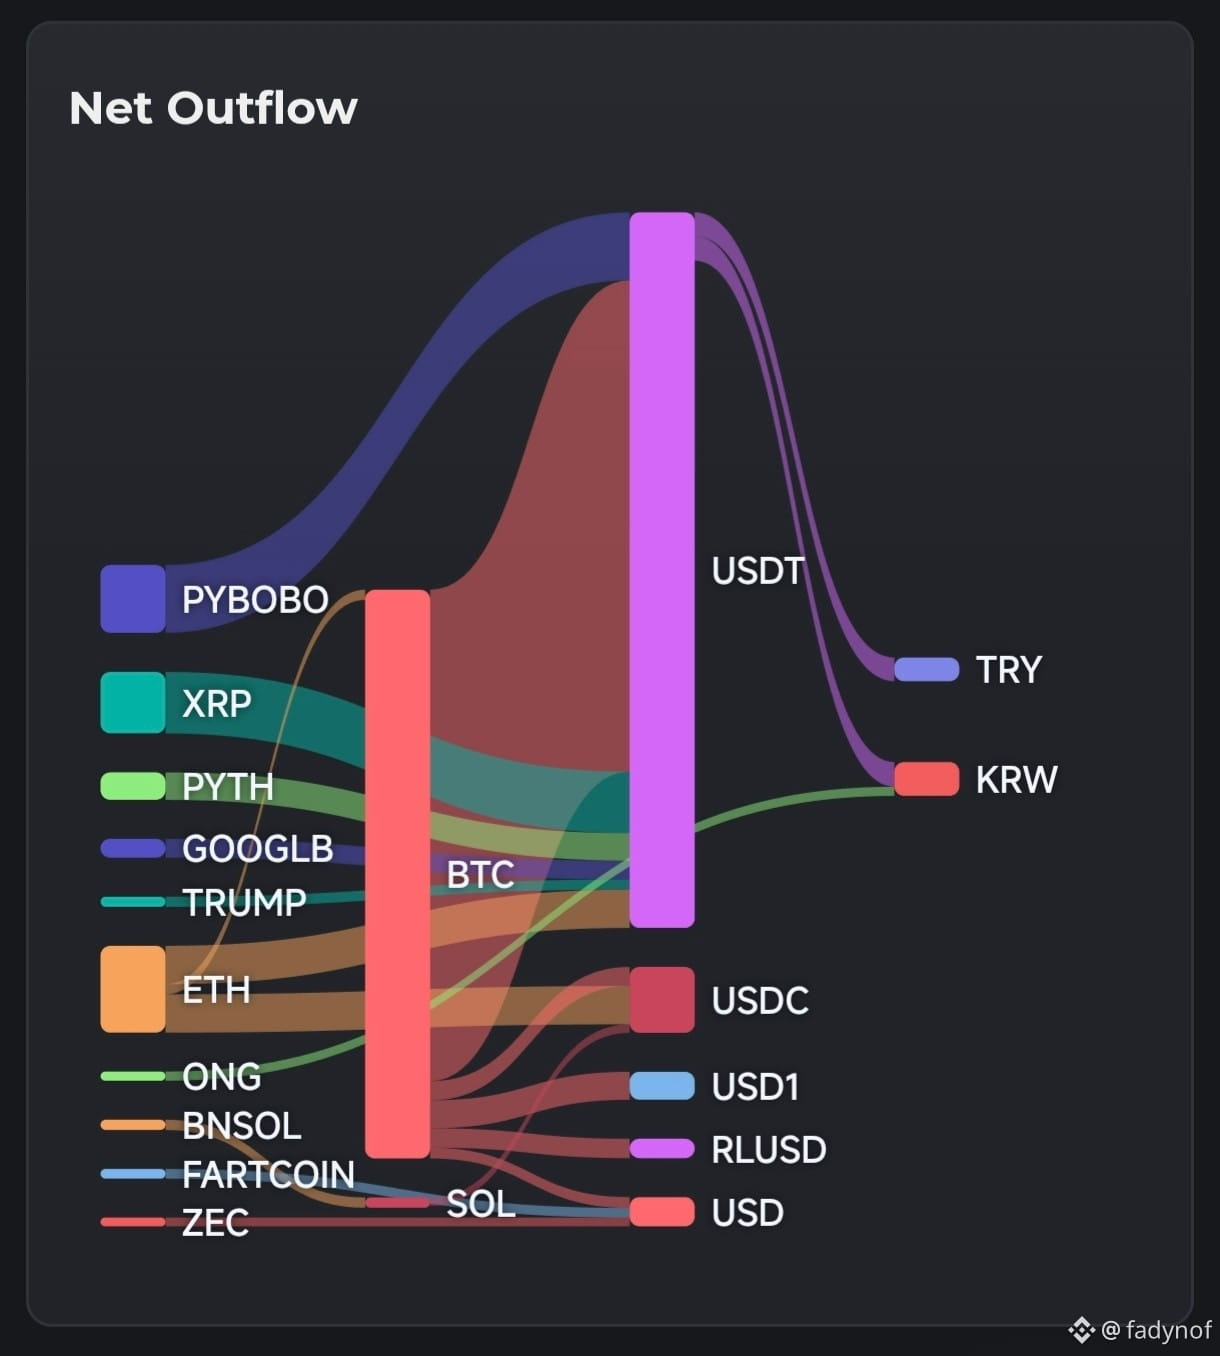
Analysis of Liquidity Flow (Volume Flow): Heavy outflow from alternative coins toward Stablecoins and Bitcoin! 🚨📉
The Sankey diagram (Sankey Diagram) of net outflows shows a wide-ranging movement of liquidity within the market, where capital shifts between coins along the following paths:
Source (Alternative coins): Coins such as PYBOBO, XRP, PYTH, ETH, SOL, ZEC, and TRUMP are seeing a strong wave of selling and withdrawals.
First stop (Bitcoin): BTC (the red column) captures a large portion of the liquidity transferred from these alternative coins as a safe haven within the market.
Main stop (USDT): The teaser (the purple column) is the biggest beneficiary, where most of the liquidity resulting from selling alternative coins and Bitcoin accumulates.
End (Cash and stable coins): In the end, liquidity is distributed among other stable coins (USDC, RLUSD, USD1) and flows toward local currencies such as TRY (Turkish Lira) and KRW (South Korean Won).
Summary: The market is in a risk-off and profit-taking state, where traders prefer to convert their profits and liquidity from alternative coins into USDT and Bitcoin or withdraw them as cash liquidity.
$BNB
$SOL
$BTC
The Sankey diagram (Sankey Diagram) of net outflows shows a wide-ranging movement of liquidity within the market, where capital shifts between coins along the following paths:
Source (Alternative coins): Coins such as PYBOBO, XRP, PYTH, ETH, SOL, ZEC, and TRUMP are seeing a strong wave of selling and withdrawals.
First stop (Bitcoin): BTC (the red column) captures a large portion of the liquidity transferred from these alternative coins as a safe haven within the market.
Main stop (USDT): The teaser (the purple column) is the biggest beneficiary, where most of the liquidity resulting from selling alternative coins and Bitcoin accumulates.
End (Cash and stable coins): In the end, liquidity is distributed among other stable coins (USDC, RLUSD, USD1) and flows toward local currencies such as TRY (Turkish Lira) and KRW (South Korean Won).
Summary: The market is in a risk-off and profit-taking state, where traders prefer to convert their profits and liquidity from alternative coins into USDT and Bitcoin or withdraw them as cash liquidity.
$BNB
$SOL
$BTC